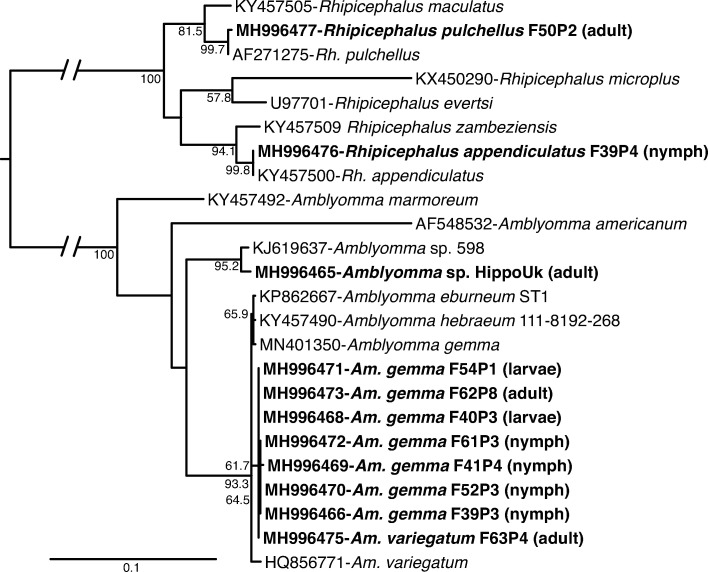
Fig 3. Maximum likelihood phylogenetic tree of tick ITS-2 gene sequences (739–1276 bp).
GenBank accession numbers, species identifications, and isolates, and tick life stages (in brackets) are indicated for each sequence. Sequences from this study are indicated in bold letters. Bootstrap values at the major nodes are of percentage agreement among 1000 replicates. The branch length scale represents substitutions per site.

