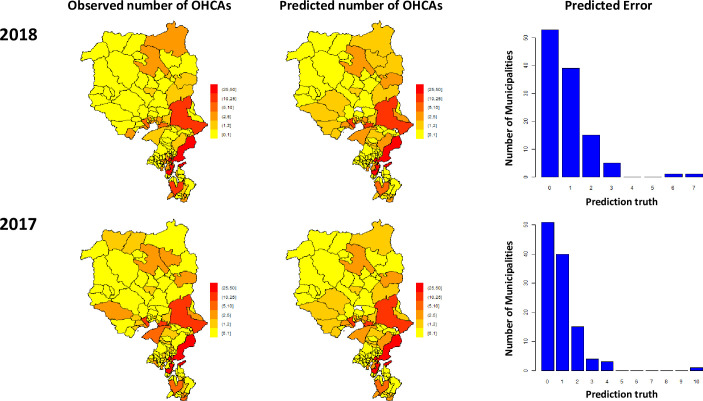
Fig 2.
Distribution of the events at the municipality level as observed in year 2017 and 2018 (panel A), and the predicted OHCA number of events as estimated by our method (panel B). Panel C shows the distribution of the number of municipalities according to the predicted error (|observed-predicted|). In the majority of cases, there was zero difference in the absolute number of OHCA between the predicted and observed number of OHCAs.

