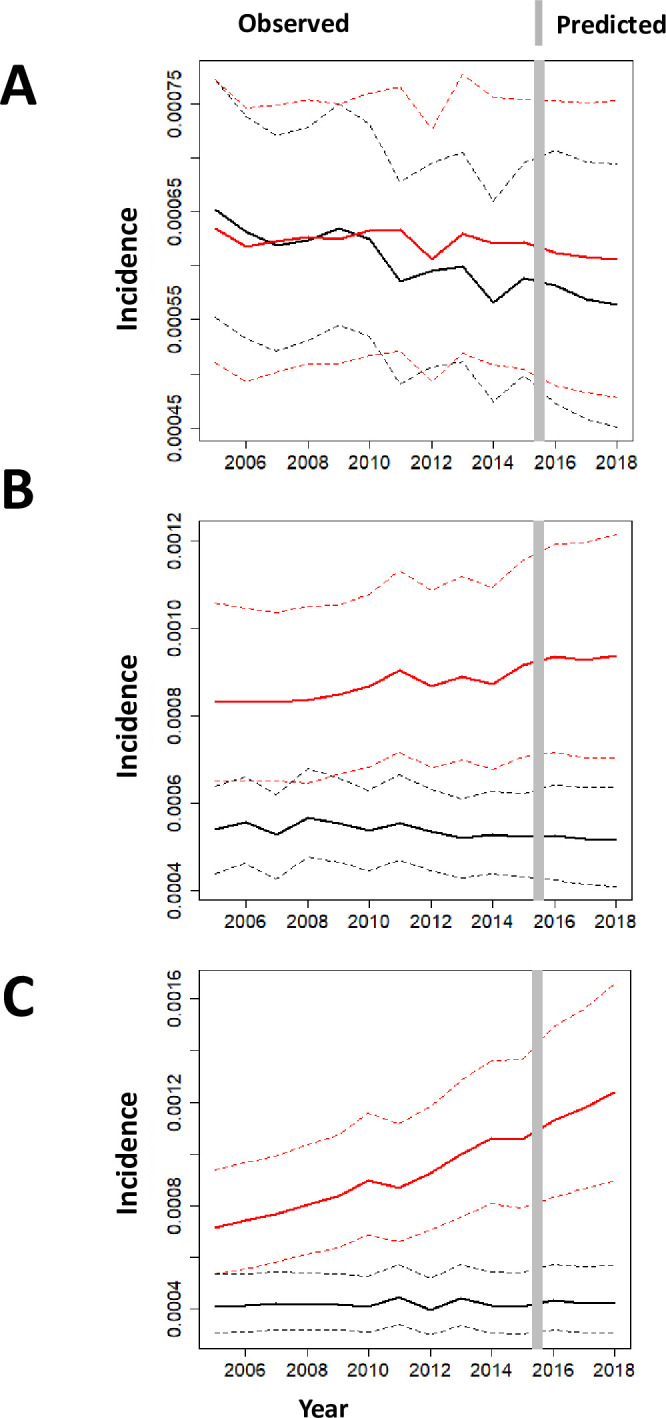
Fig 3.

Each panel (A-C) shows the estimated OHCA incidences from 2005 to 2016 in a given municipality (red) with corresponding 95% credible intervals in dashed lines, and it compares to another municipality (black). In panel A, the 2 municipalities had similar incidence over time; in panel B and C, there is a progressive increase in the number of OHCA in one municipality compared to the other one. Panel A shows two municipalities where no significant difference in the OHCA incidence all over the sample space, and no difference is predicted in the upcoming years. Panel B shows the comparison between two municipalities in which OHCA incidence is significantly different over the whole sample. The distance between the two municipalities increased over time with an unchanged trend predicted over the validation sample (year 2017–2018). The increasing difference between the two OHCA incidences seems to be related to a deterioration of OHCA incidence in one municipality whilst incidence in the other municipality appears quite stable over time. Finally, panel C shows two municipalities with mixed results. Indeed from 2005 to 2008, uncertainties in the estimates of OHCA incidence do not allow us to distinguish the two incidence rates in a statistically significant way, but from 2009 on the two incidences become significantly different, and with significance increasing over time, including the validation sample up to 2018. The difference seems to be attributed to an increase in OHCA incidence in one municipality together with a stabilization and then lower uncertainty on the OHCA incidence of the other municipality.
