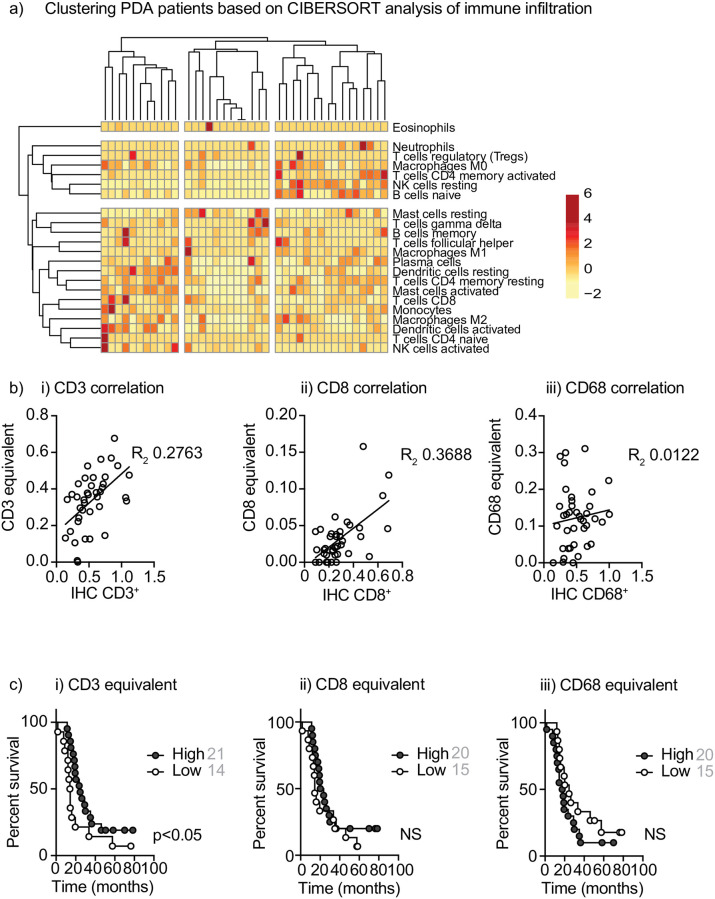
Fig 2. Evaluation of CIBERSORT analysis of immune infiltration.
a) Clustering of immune populations inferred using CIBERSORT analysis of RNASeq of PDA patients. Rows are centered; unit variance scaling is applied to rows. Both rows and columns are clustered using correlation distance and average linkage. 22 rows, 39 columns. b) The immune infiltrate score of all i) CD3+, ii) CD8+, and iii) CD68+ equivalent cell populations (Table 2) determined by CIBERSORT compared to quantitative IHC from the same patient. Each symbol represents one patient. c) Overall survival of patients with high versus low infiltrates of i) CD3+, ii) CD8+, and iii) CD68+ equivalent cell populations (Table 2) determined by median CIBERSORT infiltration. NS = not significant.

