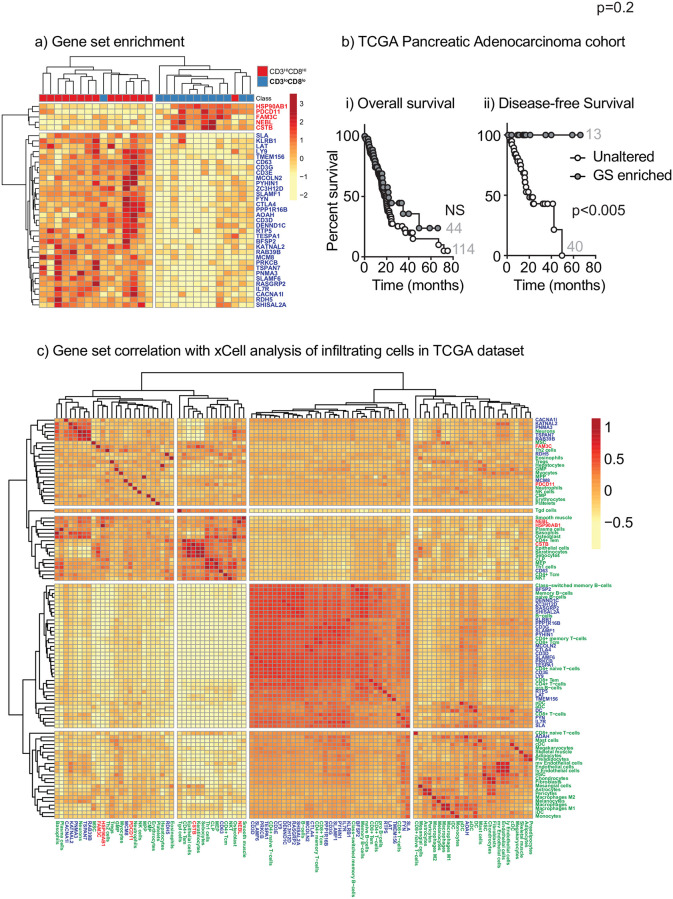
Fig 4. Class comparison of TPM counts on patients with high T cell infiltrate and validation on TCGA cohort.
a) Class comparison of TPM counts was performed on patients with high CD3+ and high CD8+ infiltrates, as compared to patients with low CD3+ and low CD8+ infiltrates using the cutoffs applied in Fig 1. Graph shows the clustering of 38 significant genes (p<0.001). Genes enriched in poorly infiltrated tumors are highlighted in bold. b) The genes enriched in highly infiltrated tumors were tested using the TCGA PanCan Pancreatic Adenocarcinoma cohort to identify patients with enriched RNA expression of these genes. Graphs show i) overall survival and ii) disease-free survival for patients in each group. The number of patients in each group is shown. c) Correlation matrix of the expression of the genes listed in a), and xCELL calculated cell infiltration for the TCGA PanCan Pancreatic Adenocarcinoma cohort. Rows are centered; no scaling is applied to rows. Both rows and columns are clustered using Manhattan distance and average linkage. 102 rows, 102 columns. Genes are highlighted in Blue where positively correlated and Red when negatively correlated. Cell types are highlighted in Green.

