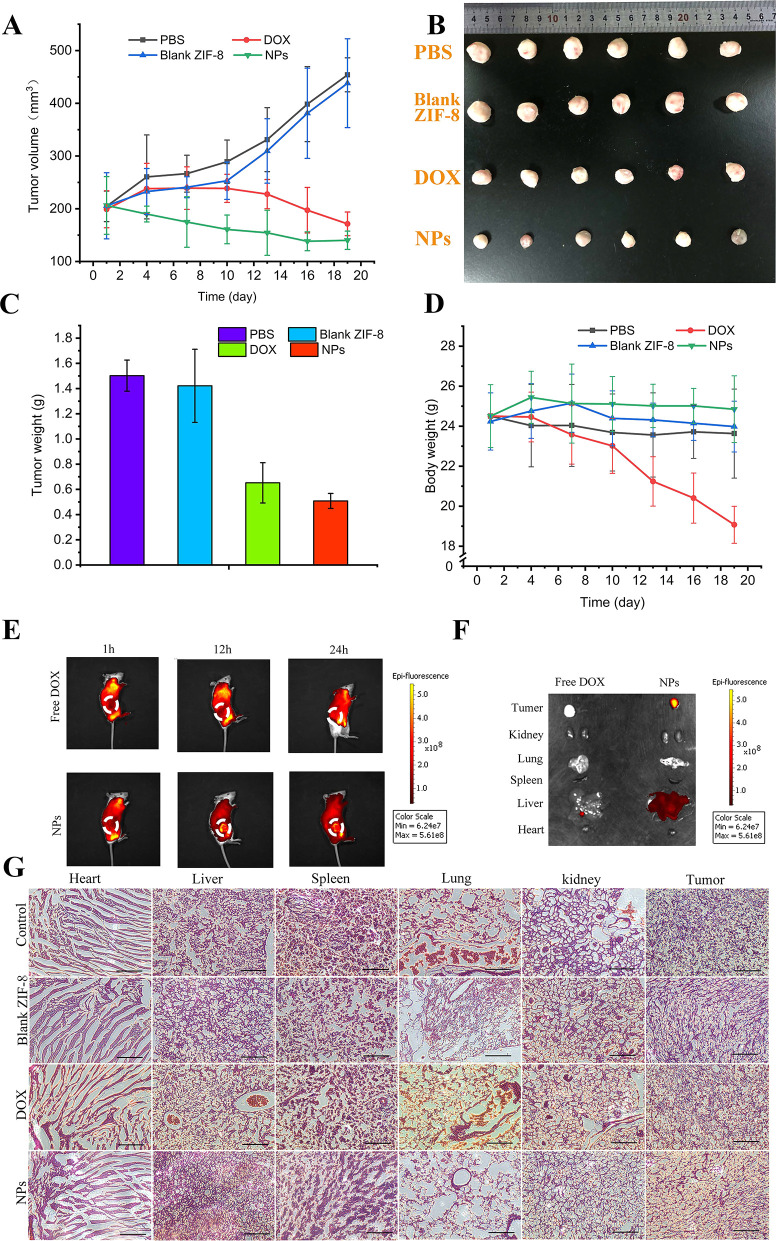
Figure 4.
In vivo antitumor therapy. (A) Change of tumor volume during treatment. (B) Photo of tumors from different groups. (C) Tumor weight change during therapy. (D) Bodyweight changes during the treatment. (E) In vivo fluorescence imaging of MDA-MB-231 bearing mice at 1, 12, 24, 48, and 72 h after the injection of free DOX and CAD@ZIF-8-FA NPs. (F) Ex vivo bioluminescence imaging of different organs. (G) H&E staining of different organs.

