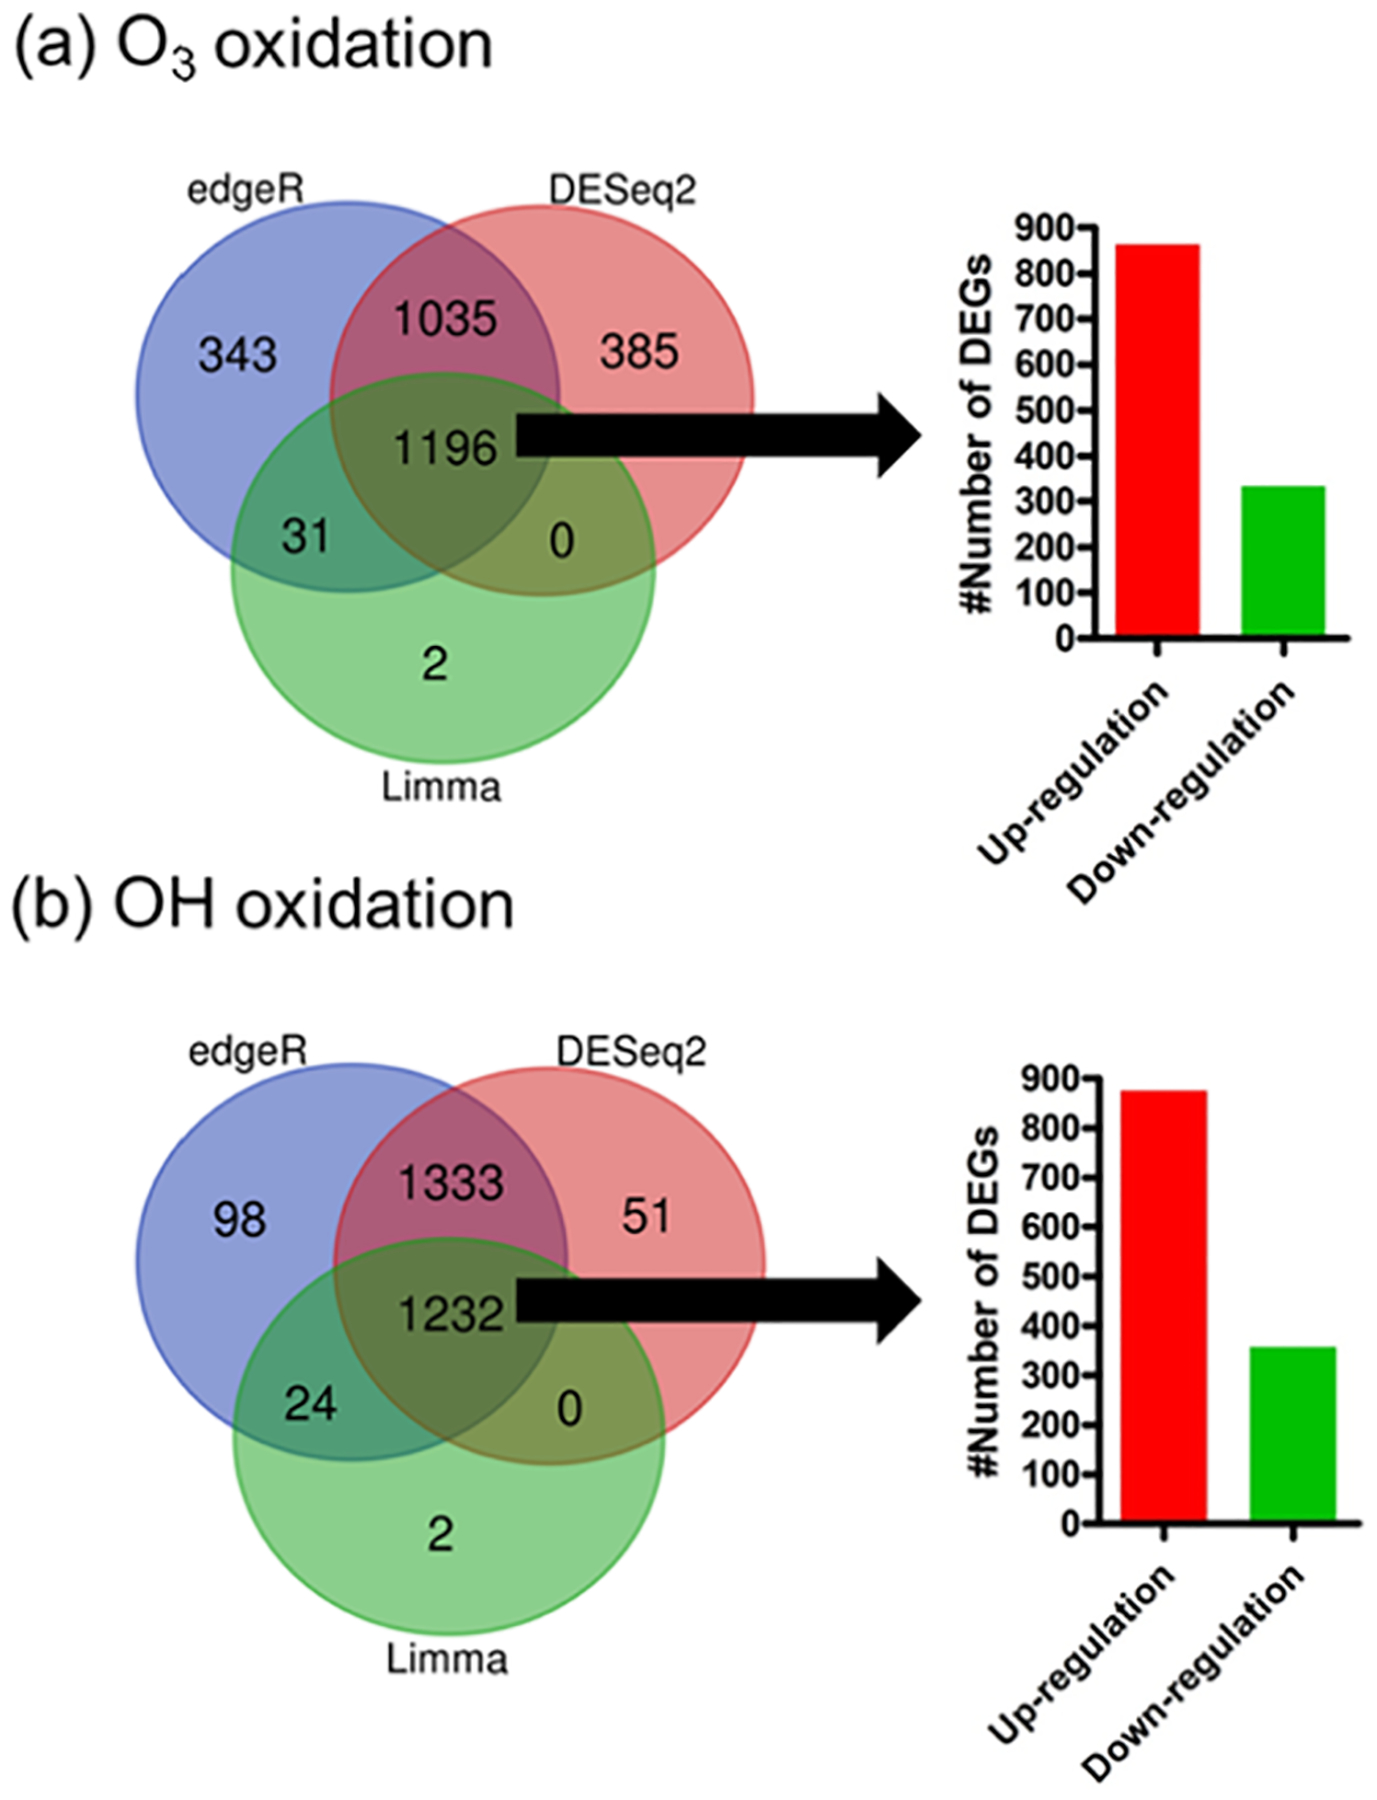
Figure 3.

DEGs identified from three different tools, including DESeq. 2, edgeR, and Limma for BEAS-2B cells exposed to DMSe-derived SOA resulting from (a) O3- and (b) OH-initiated oxidations. Sorting criteria: Log2 FC |±1|, p value = 0.01, FDR/adjusted p value =0.01, and CPM ≥ 1. Bar graphs represent the number of upregulated and downregulated DEGs in the intersections of three gene set inputs from DESeq. 2, edgeR, and Limma.
