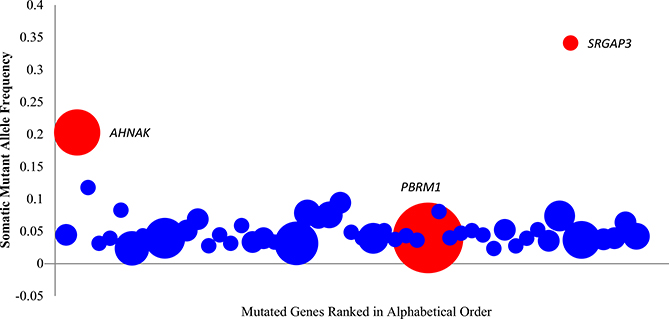
Figure 1. Somatic Mutant Allele Frequency from the Individual Patient that Contained Known Variants in the Large ccRCC Cohort of 98 Patients in Guo et al. (2012).
Mutant sites selected in cancer tissue here are covered by more than ten normal reads without any mutations in the normal tissue. The vertical axis showed the average somatic mutant allele frequency in a gene. The horizontal axis showed that mutant sites contained genes, which also present in the 98 patient cohort ranked by alphabet. The area of the circle represents the observed mutation frequency in the 98 patient cohort of each gene. AHNAK, SRGAP3, and PBRM1 were highlighted in red. For further description of the genetic analysis of cancer and normal tissue sequencing data, see also Table 1, Figure S1, and Figure S2.

