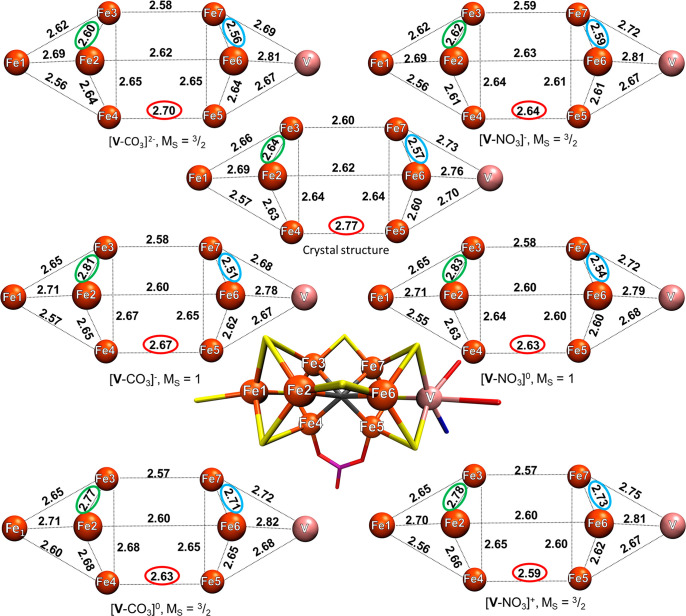
Figure 4.
Metal–metal distances of six QM/MM models (QM region: 181 atoms) calculated using the BS7-235 solution compared to the X-ray structure. The green and blue ellipsoids highlight the Fe2–Fe3 and Fe6–Fe7 distances that are strongly affected by the redox state. The red ellipsoid highlights the change in the Fe4–Fe5 distance with the bridging XO3 ligand. The metal–metal distances of the crystal structure are the average of the two cofactors found in the 5N6Y crystal structure. All distances are in angstroms.

