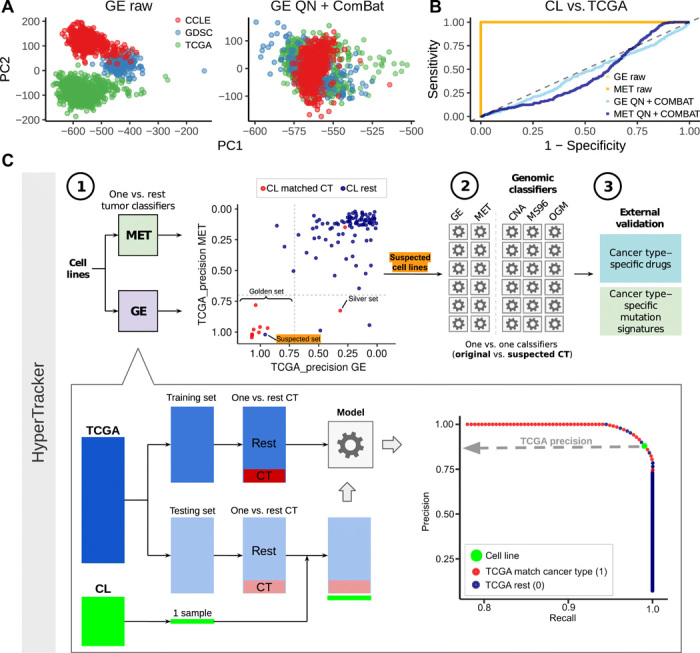
Fig. 1. Methodology for data alignment and cancer type classification.

(A) Principal component (PC) 1 and PC2 of a PCA, in the gene expression (GE) data, before adjustment for batch effects (raw data) and after adjustment [quantile normalization (QN) + ComBat] [see fig. S1 for PCA of DNA methylation data (MET)]. Colors represent the dataset sources (GDSC and CCLE are two sources for the cell line data, and TCGA is the source for the tumor data). (B) ROC curves for classifying tumors versus cell lines in the data before adjustment (orange) and after adjustment (blue) for GE and MET. (C) Schematic overview of the HyperTracker methodology. First, we systematically identified possible mislabeled cell lines using GE and MET data, independently. Second, we used various types of mutation-based data to corroborate the predictions. Third, we further validated the cell lines (CL) suspected to originate from skin using independent data, such as drug sensitivity. CT, cancer type.
