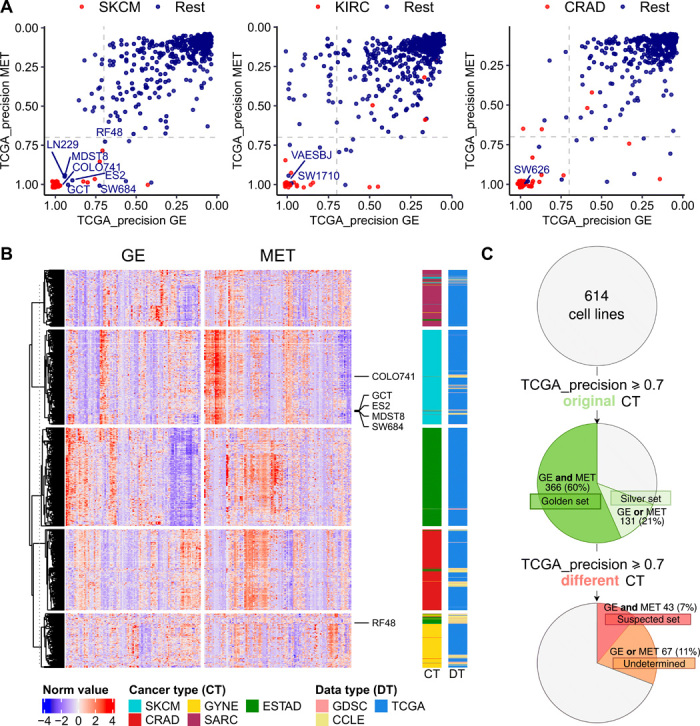
Fig. 2. Detection of cell lines suspected to be mislabeled with a different cancer type.

(A) TCGA-based precision scores for 614 cell lines were calculated in the MET and GE cancer type classifiers (one-versus-rest) and for 69 blood cancer cell lines. The higher the precision, the higher the confidence that the sample belongs to that particular cancer type (here, showing cases of SKCM, KIRC, and CRAD from left to right; see fig. S2 for the other cancer types). The cell lines that were originally annotated as the cancer type that is being tested are shown in red, and the rest in blue. (B) Heat map showing the 25 genes (GE) and CpG probes (MET) with the highest absolute values of ridge regression coefficients for each of the cancer types in the plot in one-versus-rest classifiers. The suspected skin cell lines are labeled. The cancer types shown are the suspected cancer type [melanoma (SKCM) in this case] and, additionally, the originally declared cancer types of the suspected cell lines [here, esophagus and stomach cancer (ESTAD), sarcoma (SARC), colorectal cancer (CRAD), and ovarian and uterus cancer (GYNE)]. See fig. S3 for the heat maps for the rest of the suspected cell lines. (C) Overview of the results from the systematic mislabeling testing of all cell lines. Cell lines with a TCGA_precision ≥ 0.7 to its original cancer type in (i) both in GE and in MET are assigned to the golden set group and (ii) either in GE or in MET are assigned to the silver set. If, however, the TCGA-based precision ≥ 0.7 to a different cancer type in GE and in MET, the cell line is assigned to the suspect set.
