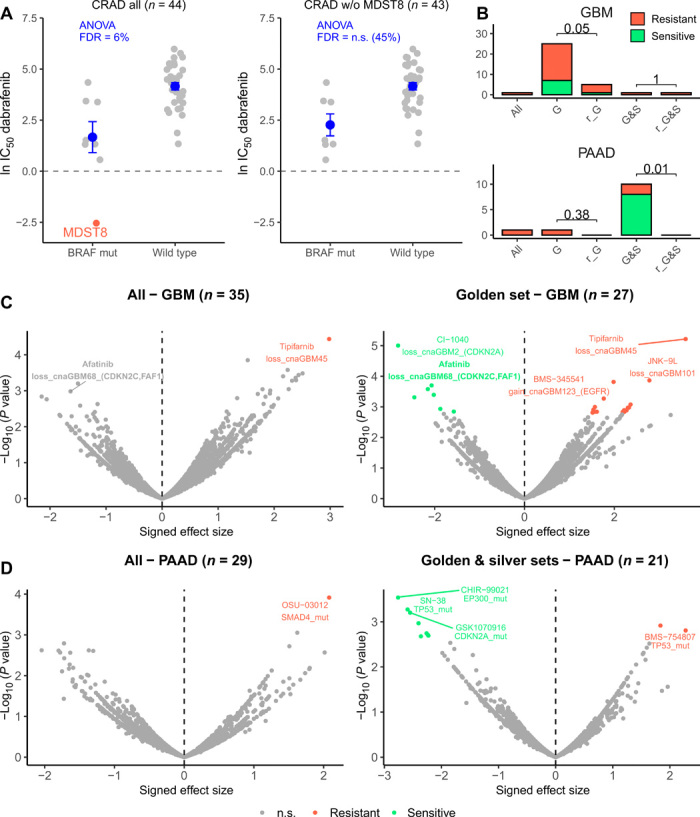
Fig. 4. Drug sensitivity association testing using high-confidence sets of cell lines.

(A) Drug sensitivity (IC50) to dabrafenib in all colorectal (CRAD) cell lines (left) and all CRAD cell lines except MDST8 (right), which is suspected of being skin cancer. Cell lines with a BRAF mutation and without (wild type) are compared. ANOVA FDR for this association (dabrafenib sensitivity with BRAF mutation status) is shown in blue for both datasets. Horizontal line is shown at 0, because score < 0 implies sensitivity to the drug. Dots and error bars represent the mean and SEM. (B) Number of significant associations between “CFEs” (includes mutations and CNAs in cancer genes) and drug associations detected (at FDR 25%) in the ANOVA test for all cell lines (“all”), cell lines in the golden set (“G”), cell lines in the golden plus silver sets (“G&S”), random subset of cell lines that match the number in the golden set (“r_G”), and random subset of cell lines that match the number in the golden plus silver sets (“r_G&S”). For the random subsets, the number of significant associations is calculated from 10 random selections and median shown. P values for a sign test (one-tailed) between the number of associations in the G/G&S and in r_G/r_G&S are shown. See fig. S7 for the remaining cancer types. (C) Differential sensitivity of drugs was analyzed by ANOVA for all brain cancer cell lines (left) and the brain cancer cell lines in the golden set only (right). Each point is an association between the sensitivity of a drug and a genetic feature (CFE). (D) Differential sensitivity of drugs was analyzed by ANOVA for all pancreatic (PAAD) cell lines (left) and PAAD cell lines in the golden and silver set only (right). Each point is an association between the sensitivity of a drug and a genetic feature (CFE). n.s., not significant.
