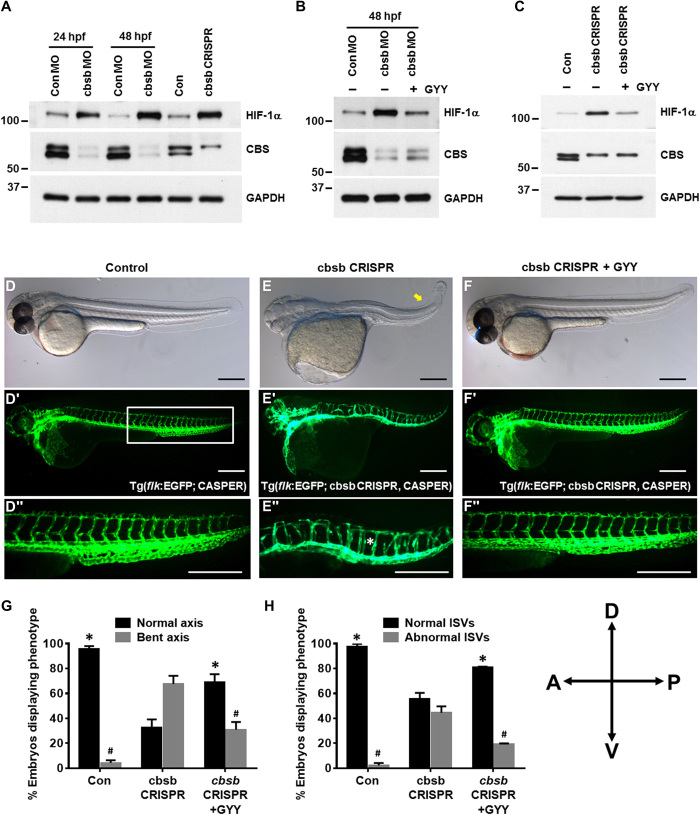
Fig. 4. Inhibition of CBS-stabilized HIF-1α in zebrafish embryos caused abnormal development of ISVs.
(A) Zebrafish embryos were injected with either control MO (ConMO) or cbsb MO (cbsb MO), and embryos assessed at 24 or 48 hpf or zebrafish embryos were injected with control and cbsb CRISPR and assessed at 48 hpf. The protein expression of HIF-1α and CBS in the embryo lysates was evaluated by immunoblotting. Glyceraldehyde-3-phosphate dehydrogenase (GAPDH) was used as a loading control. (B) ConMO or cbsMO-injected zebrafish embryos were treated with or without 0.5 mM GYY4137 (GYY) at 6 hpf, and at 48 hpf, immunoblotting was performed with the indicated antibodies. (C) Control and cbsb CRISPR fish embryos were treated with or without 0.5 mM GYY4137 (GYY) at 6 hpf, and at 48 hpf, immunoblotting was performed with the indicated antibodies. (D to F) Bright-field whole mount images (D to F) and fluorescent images of the vasculature (D′ to F′) are shown at 52 hpf for embryos from either Tg[flk:EGFP (enhanced green fluorescent protein); CASPER] line (control) or the Tg(flk:EGFP; cbsb CRISPR, CASPER) line (cbsb CRISPR) were treated or not with GYY4137 (0.5 mM) or dimethyl sulfoxide at 6 hpf and were imaged. The box in (D″) indicates the region of enhancement in images (D″) to (F″). The bent axis is marked by the yellow arrow in (E), and disrupted ISVs are marked by the white asterisk in (E″). Each scale bar represents 0.25mm. (G and H) Quantification for axis and ISVs, respectively. Data are the means ± SD of three independent experiments. *P < 0.05 when comparing normal axis/normal ISVs of cbsb CRISPR with all other groups and #P < 0.05 when comparing abnormal axis/abnormal ISVs of cbsb CRISPR versus other groups. The embryo orientation in all the figure panels, left is anterior (A) and right is posterior (P), while top is dorsal (D) and bottom is ventral (V). n = 99 embryos for the control group, n = 52 embryos for the cbsb CRISPR group, and n = 52 embryos for the cbsb CRISPR + GYY group, which are total number of embryos from three independent experiments.

