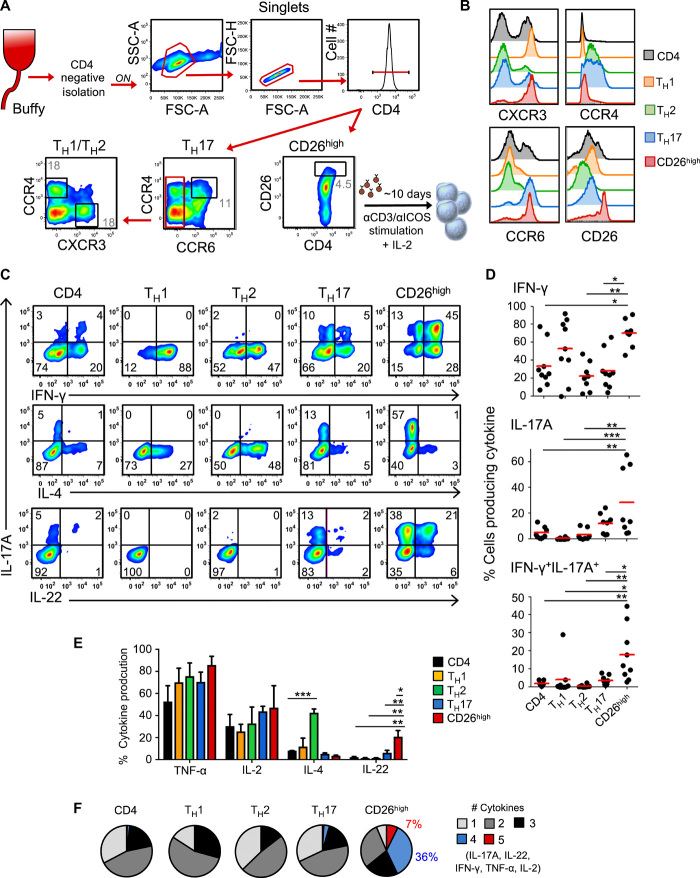
Fig. 1. CD4+CD26high T cells have a dynamic cytokine profile.
(A) CD4+ subset sorting scheme. CD4+ lymphocytes were negatively isolated using magnetic beads from normal donor peripheral blood lymphocytes (PBLs). TH17 cells were sorted from the CCR6+CCR4+ gate. TH1 and TH2 cells are both CCR6− and subsequently sorted via CXCR3 or CCR4, respectively. CD26high cells were sorted independently on the basis of CD26 expression. (B) Chemokine receptor profile after sort. (C) CD4+ T cell subsets were stimulated with αCD3/inducible costimulator (ICOS) beads at a ratio of 1 bead:10 T cells and expanded in IL-2 (100 IU/ml). Ten days following activation, the five different cell subsets were examined for their intracellular cytokine production. Dot plot representation of IL-17, interferon-γ (IFN-γ), IL-4, and IL-22 expression by flow cytometry. (D) Graphical representation of at least eight normal donors from independent experiments demonstrating IFN-γ and IL-17 single and double producing cells by flow cytometry. (E) Graphical representation of 10 normal donors demonstrating cytokine-producing cells by flow cytometry. Two to three replicates each. Analysis of variance (ANOVA), Tukey’s post hoc comparisons; *P < 0.05, **P < 0.01, and ***P < 0.001. (F) Cells were gated on cytokine-producing cells to quantify cells that produced between one and five cytokines simultaneously. Cytokines of interest were IL-17, IFN-γ, IL-2, IL-22, and tumor necrosis factor–α (TNF-α). Representative of five experiments.

