
Fig. 2. RCAN1core domain, amino acids 128 to 164, folds-upon-binding CN.
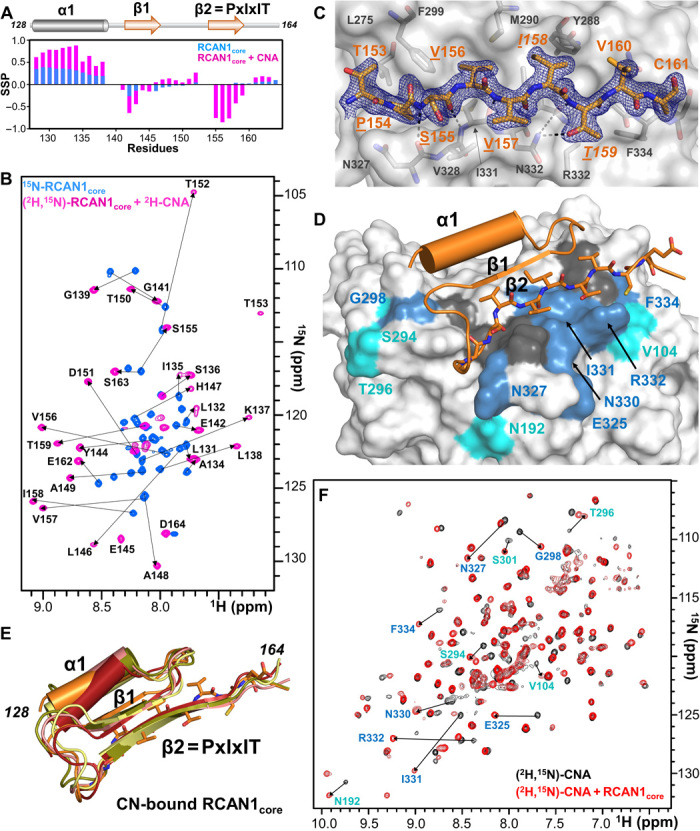
(A) Secondary-structure propensity data plotted against RCAN1core residue numbers (SSP > 0, α helix; SSP < 0, β strand). RCAN1core, blue; CNA-bound RCAN1core, pink. (B) Overlay of the 2D [1H,15N] TROSY spectrum of free 15N-labeled RCAN1core (blue) with the 2D [1H,15N] TROSY spectrum of (2H,15N)-labeled RCAN1core bound to (2H)-labeled CNA (pink). Arrows indicate the peak shifts in RCAN1core upon binding CN. (C) 2mFo − DFc electron density map (blue) contoured at 1σ corresponding to the RCAN1core PxIxIT motif (orange sticks; PxIxIT motif residues underlined) bound to CN (gray). CN residues that form the PxIxIT motif hydrophobic docking pocket shown as sticks and labeled. (D) Structure of RCAN1core:CNA complex obtained using NMR and x-ray data corefinement. RCAN1core, orange (PxIxIT motif shown as sticks; strand β1, arrow, helix α1, cylinder); CNA, white surface with the CNA residues that experience CSPs upon RCAN1core binding shown in blue (>2σ SD) or light blue (>1σ SD); dark gray surface corresponds to unassigned residues. Residues that experience CSPs are also labeled. (E) Overlay of the five lowest-energy corefined structures. (F) Overlay of the 2D [1H,15N] TROSY spectra of (2H,15N)-labeled CNA in the absence (black) and presence (red) of the RCAN1core. Peaks that shift in the presence of the RCAN1core are shown with arrows and labels. Label colors correspond to chemical shift perturbation deviation magnitudes [see (D)].