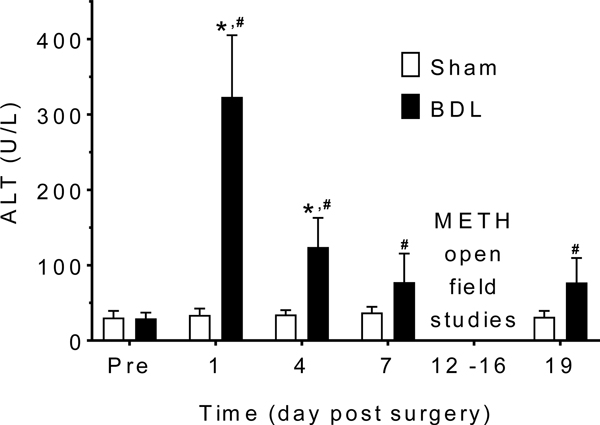
Figure 1.
ALT on days after surgery. Mean ALT + SD was stable in the sham group on all measurement days. There was a significant elevation on days 1 and 4 in the BDL compared to sham rats. Day 7 levels were measured before any exposure to METH. ALT did not increase in sham or BDL rats after METH exposure. The * denotes significant difference between sham and BDL groups (p < .05). The # denotes significant difference between the pre-surgery (Pre) and post-surgery values in the BDL group (p < .05). (n = 6 sham, n = 9 BDL)

