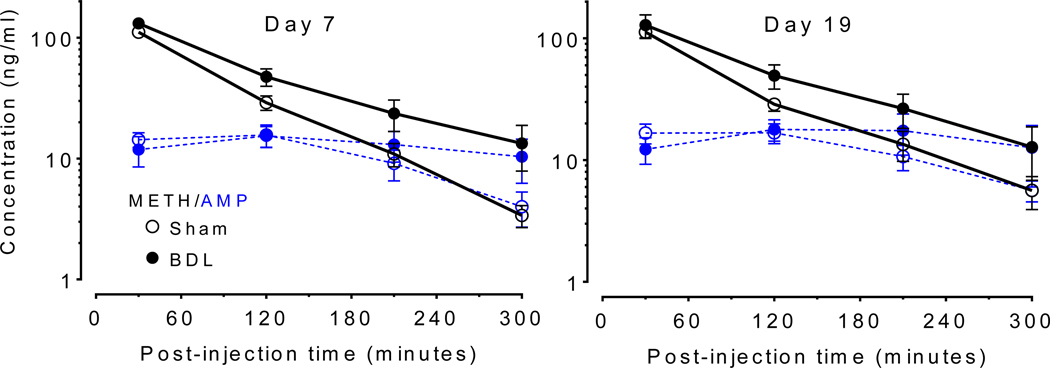
Figure 5.
METH and AMP Serum concentration after 1 mg/kg METH administration before (day 7) and after (day 19) open field experiments. Mean serum METH (black solid lines) and amphetamine (AMP) metabolite (blue dashed lines) concentrations ± SD are plotted for the sham (open circles) and BDL (closed circles) groups on day 7 (METH naïve) and day 19 (post-METH exposure). (n = 6 sham, n = 9 BDL)

