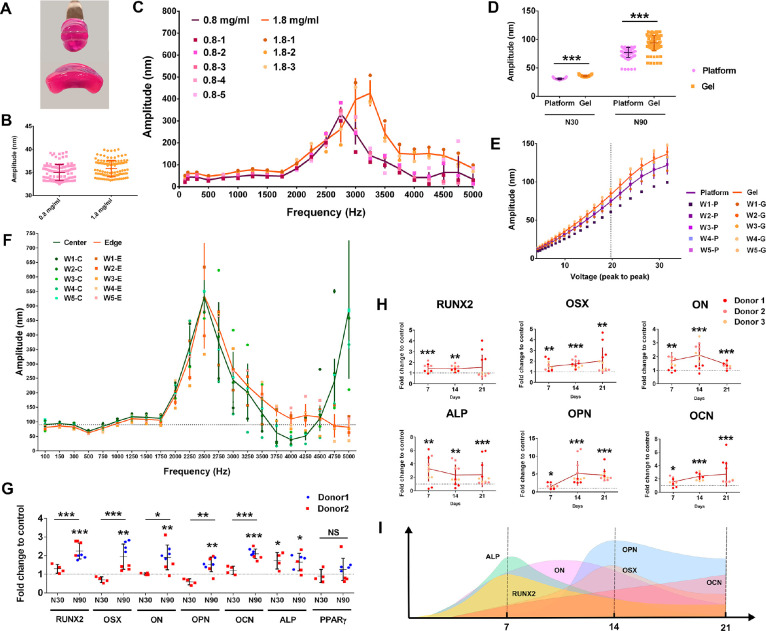
Figure 1.
3D MSC osteogenesis with N30 and N90 nanostimulation. (A) Collagen gel constructed with 0.8 mg/mL (top) and 1.8 mg/mL (bottom) (note that both are front views, and the gel diameter was 13 mm before removing from the well). (B) Interferometry showing that 0.8 and 1.8 mg/mL collagen gels vibrate as expected with N30 stimulation (n = 24). (C) Using interferometry, resonance effects were seen at frequencies >2000 Hz, but no resonance peaks were seen at 1000 Hz, for both 0.8 and 1.8 mg/mL collagen gels (n = 3–5). (D) Interferometry results for N30 and N90 nanostimulation, showing good fidelity of vibration in the 1.8 mg/mL collagen gel (n = 24). (E) Interferometry showed a linear voltage–amplitude relationship for both the vibration platform and the 1.8 mg/mL collagen gel (n = 5) between 12 and 27 Vpp. (F) No resonance frequencies were seen at 1000 Hz at either the center or edge of the 1.8 mg/mL collagen gels (n = 5). (G) Osteogenic marker gene expression in MSCs, as assessed by qPCR for N90 compared to N30 (or control), after 9 days of culture in 3D nanovibrational stimulation conditions in 1.8 mg/mL collagen gels. Osteogenic marker gene expression was enhanced in N90 conditions, compared to N30 or control conditions (d = 2, r = 4, t = 3). (H) Osteogenic transcript expression in N90 conditions in 1.8 mg/mL collagen gels at days 7, 14, and 21 of culture. (I) Schematic of expression maxima with time (d = 3, r = 4, t = 3). Significance calculated using ANOVA with Tukey multiple comparison, where * = p < 0.05, ** = p < 0.01, and *** = p < 0.001. Error bars represent means ± SD. The data shows good fidelity and improved efficacy of 3D nanostimulation with change in gel stiffness and with increased vibration amplitude. Abbreviations: d = number of donors assessed; r = number of wells tested; and t = technical replicates. Donors are MSCs derived from different donor sources.

