Figure 1.
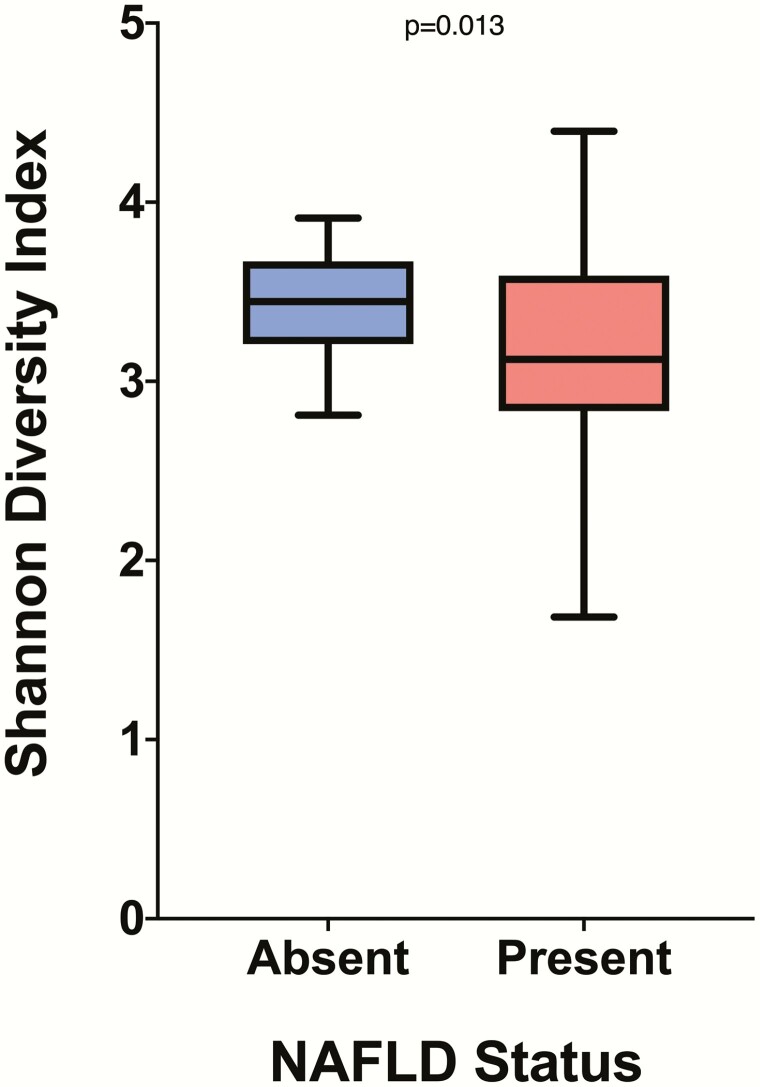
Alpha diversity in NAFLD absent and present groups. The figure shows a significant difference (P = 0.013) in Shannon diversity index values between the group without NAFLD, in blue, and the group with NAFLD, in red. Boxplots are presented in Tukey style. The groups were compared using Welch’s t test.

