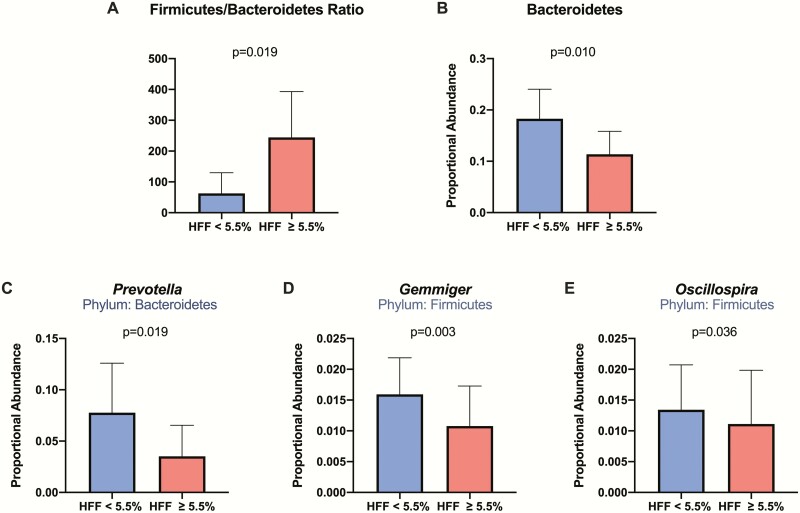
Figure 2.
Difference in phylum/genus abundance in HFF groups. The figure shows the mean with SD in Firmicutes/Bacteroidetes (F/B) ratio (A), Bacteroidetes abundance (B), Prevotella abundance (C), Gemmiger abundance (D), and Oscillospira abundance (E) observed in the 2 HFF groups. The group without NAFLD is shown in blue and the group with NAFLD is shown in red. The 2 groups were compared using Mann-Whitney U test.

