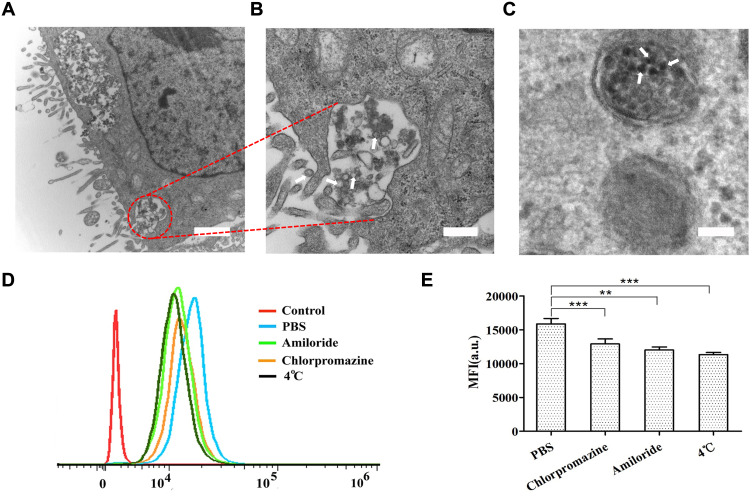
Figure 3.
Representative TEM images of NPs-EPI in HepG2 spheroid sections. Arrows showed the drug-loaded micelles NPs-EPI. The micelles were discovered in the vesicles (A, B) and lysosomes (C). Flow cytometric profiles of cellular uptake of NPs-EPI (D). The average fluorescence intensity of EPI in different treatment groups (E). **P<0.01, ***P<0.001. Data represent the mean±SD (n=3). Scale bars for A, B, and C represent 500 nm, 200 nm, and 100 nm, respectively.

