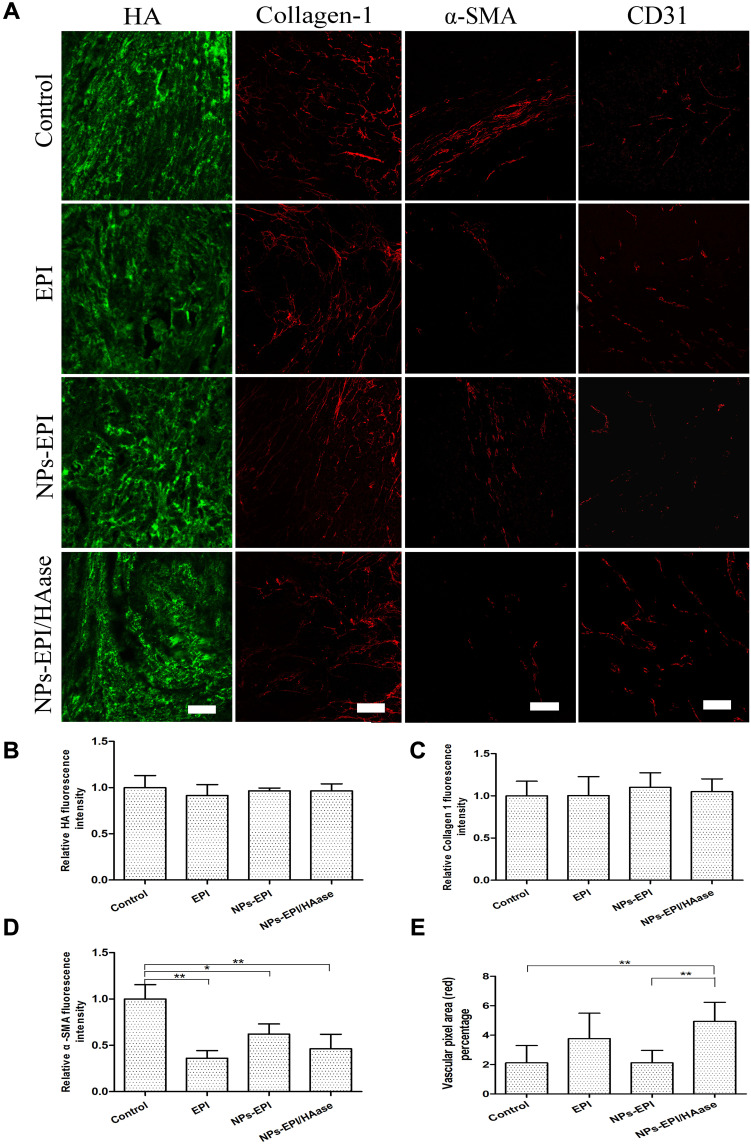
Figure 9.
(A) Immunofluorescence imaging of tumor slices after treatment with saline, EPI, NPs-EPI and NPs-EPI/HAase. Saline-injected tumor slices were invoked as the control. The HA was stained with HABP, collagen I was stained with the anti-collagen I antibody, α-SMA was stained with the anti-α-SMA antibody, tumor blood vessels were stained with the anti-CD31 antibody, respectively. The nuclei of cells (blue) were stained with DAPI. Scale bar represents 100 μm. Quantitative analysis of HA (B), collagen I (C) and α-SMA (D) fluorescence intensity used Image J. The average fluorescence intensity of tumors from saline-treated mice was set as 1. (E) Statistic data of vascular pixel area (red) percentage of tumors slices used Image J. Values indicate mean ±SD (n=6 from 3 tumor samples per study group). *P<0.05, **P<0.01.

