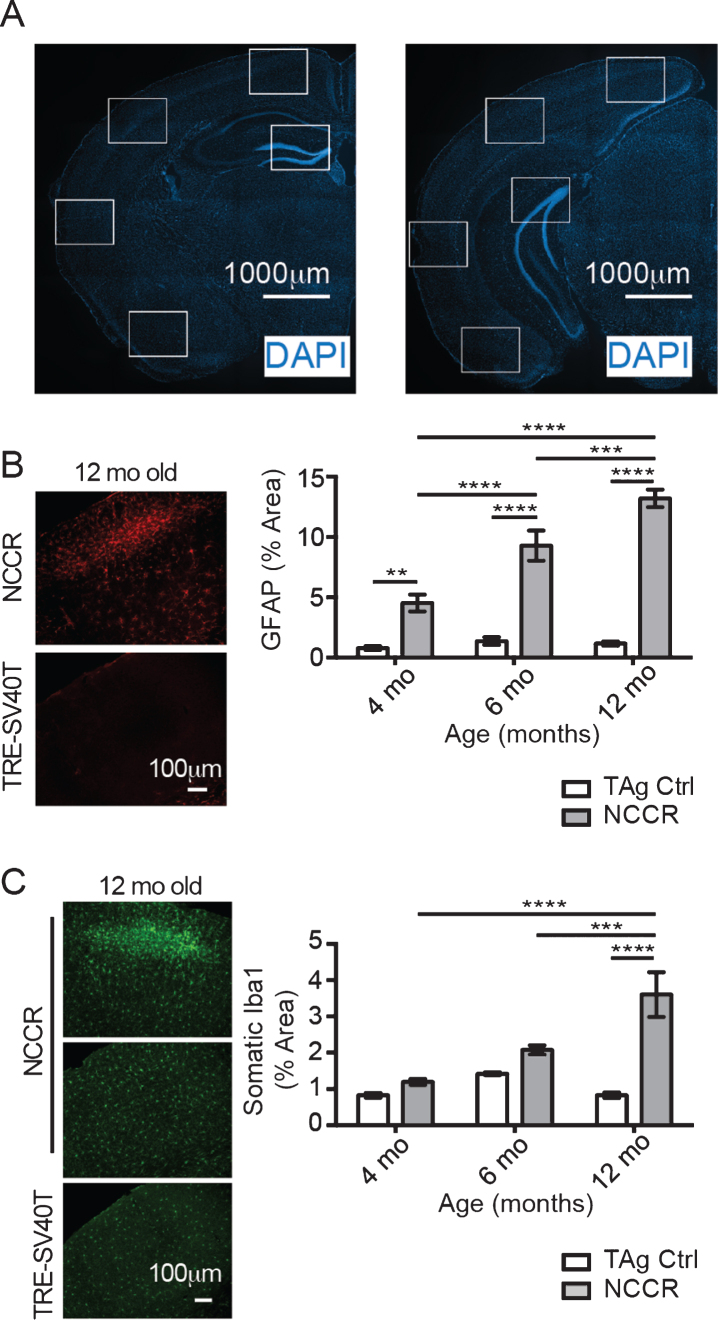
Fig.3.
The time course of neuroinflammation in the NCCR mice was determined by quantifying the percent of areas covered by GFAP and Iba-1 immunofluorescence signal. A) Representative Hoechst stained images showing the rostral and caudal sections stained for quantification. Anatomically matched brain sections were double-immunofluorescence labeled with GFAP and Iba-1. White boxes indicate the regions of interest measured using Image J software. The measures were taken from both hemispheres. B) Representative sample field images of GFAP immunofluorescence from 12-month-old NCCR and TAg control animals used for quantifying the percent area covered using Image J software. Two-way ANOVA analysis on percent area stained with GFAP shows significant age effect (F(2,162) = 22.6, p < 0.0001), genotype effect (F(1,162) = 204.7, p < 0.0001), and interaction effect (F(2,162) = 18.82, p < 0.0001). Tukey’s multiple comparison test demonstrates statistically significant age-dependent increase in the NCCR animals. On the other hand, there is no statistical difference between TAg animals at different age. NCCR animals show significantly greater GFAP-immunoreactive areas compared to TAg animals at all time points. C) Representative sample field images of Iba-1 immunofluorescence from 12-month-old NCCR and TAg control animals used for quantifying the percent area covered using Image J software. Two-way ANOVA analysis on percent area stained with Iba-1 shows significant age effect (F(2,210) = 12.56, p < 0.0001), genotype effect (F(1,210) = 34.91, p < 0.0001), and interaction effect (F(2,210) = 12.56, p < 0.0001). The averaged values for percent area covered by Iba-1 increases with age in the NCCR animals. However, only the values measured at 12-months of age in the NCCR mice were statistically different from age-matched TAg animas and 4 and 6 months of age animals of either genotypes. There was no age-dependent change in the TAg control littermates. p-values in the graphs are adjusted p-values from Tukey’s multiple comparison tests (*p < 0.05; **p < 0.01; ***p < 0.001; ****p < 0.00001). n = 2 animals per group, with 2 sections per animal and 20 regions of interest evaluated per brain section. Values are mean±SEM.

