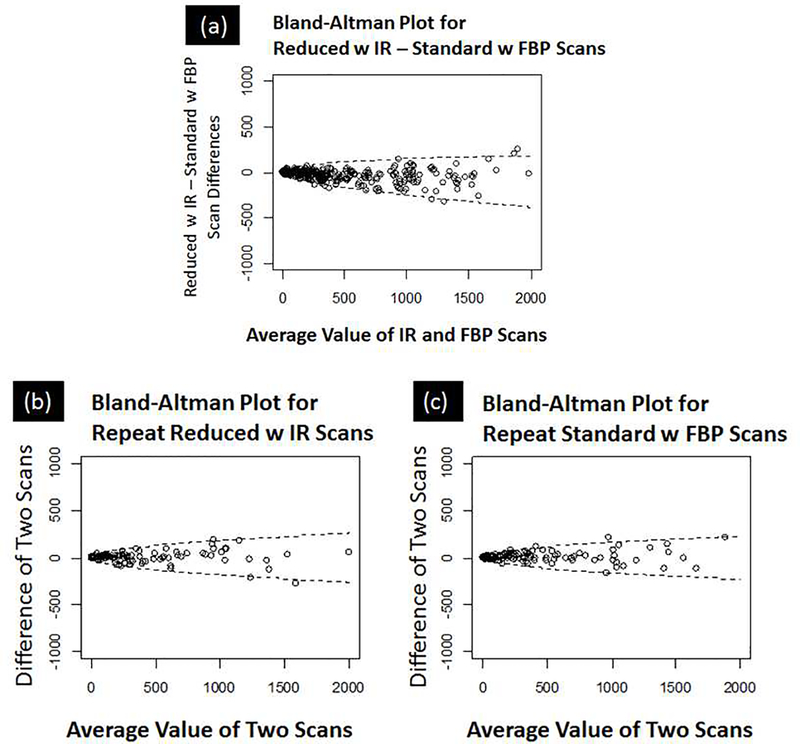
Figure 3:
(a) Difference between reduced-dose/IR – standard-dose/FBP Agatston Scores: Bland-Altman plot of difference between reduced-dose/IR and standard-dose/FBP combinations with upper and lower 95% confidence bounds shown. The difference in reduced-dose/IR and standard-dose/FBP was small at low values (<400) and increased as the mean scores increased. The 95% repeatability bounds for the reduced-dose/IR – standard-dose/FBP scan differences are −0.05 · average value .
(b) Repeatability of reduced-dose/IR and (c) standard-dose/FBP calcium scores: The variability for both reduced-dose/IR and standard-dose/FBP was small at low values (<400) and increased as the average scan scores increased. Superimposed on the Bland-Altman plots are the 95% repeatability bounds for the scan differences. For reduced-dose/IR, the 95% bounds are . For standard-dose/FBP, the 95% bounds are .

