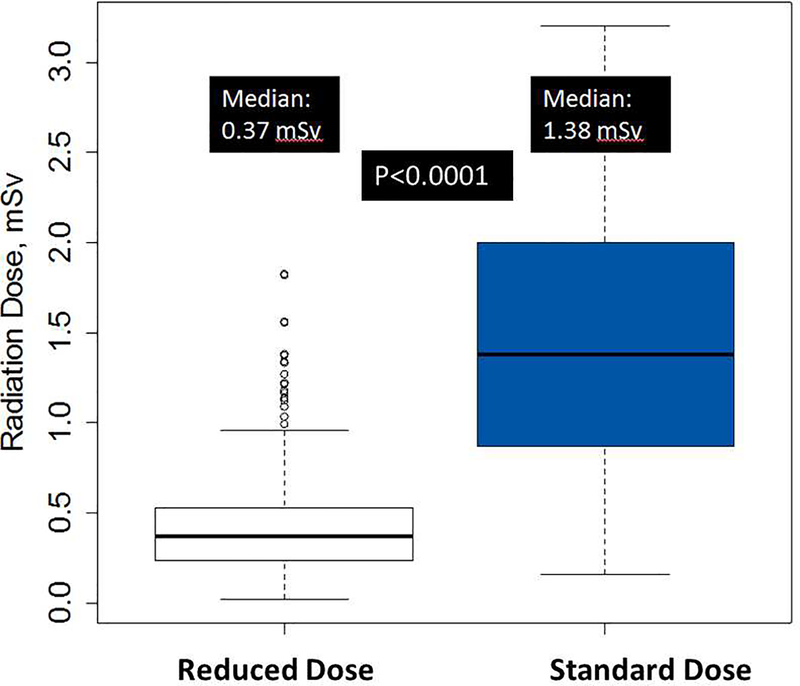
Figure 4: Radiation Exposure for Reduced vs. Standard Dose Scans:
As shown in the following box and whisker plots, median radiation exposure for reduced dose was median 0.37 mSv (5th, 95th: 0.15, 1.17) and for standard dose was median 1.38 mSv (5th, 95th: 0.46, 3.18). For reduced-dose scans, the outliers represent patients with high BMI (36–45 kg/m2) where the automatic exposure control determined to use high tube current. For standard-dose scans, the scanner reached maximal x-ray tube output so there are no outliers beyond the 1.5 * interquartile range. The median radiation reduction was 74% for reduced-dose vs. standard-dose scans (p<0.0001).

