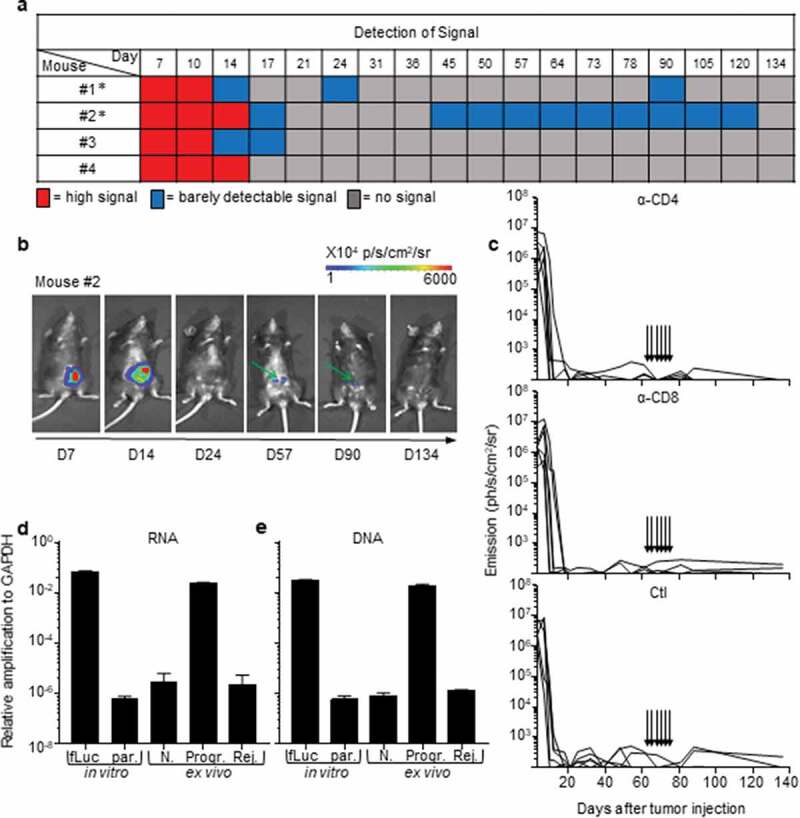
Figure 2.

Rejection of MC38-fLuc tumors leads to elimination.
(a) Bioluminescent signals of 4 representative mice from the rejecting CRC group following IC-implantation of 1 × 10⁶ MC38-fLuc cells. Mice with * exhibit possible dormancy (n = 42% of rejecting CRC group, of the three independent experiments displayed in Table 1, n = 32 mice). (b) Bioluminescent images of a representative mouse (#2 from a) possibly exhibiting dormant tumor cells at various time points. Green arrows indicate the weak signal detected at day (D) 57 and 90. (c) Bioluminescence emission monitoring in mice from the CRC-rejecting group (following D0 IC injection of 1 × 10⁶ MC38-fLuc), depleted through injection (indicated by arrows) of anti(α)-CD4 antibody (Ab) (upper panel, n = 6 mice), α-CD8 Ab (middle panel, n = 6 mice) or control (Ctl, bottom panel, n = 5 mice). (d, e) Relative expression of RNA following RTPCR and qPCR (RNA, d) and amplification of genomic DNA following qPCR (DNA, e) in colons dissected from rejecting-CRC mice (Rej.) ex vivo n = 13 mice with n = 6 mice at D84 and n = 7 mice at D194 post-IC MC38-fLuc tumor implantation. Controls (ctl) are represented by in vitro tissue-culture MC38-fLuc (fLuc, positive ctl) and parental (par., negative ctl) cells, ex vivo naïve cecum (N., negative ctl) and D61 IC-tumor bearing mice from progressive-CRC group (Progr., positive ctl) (n = 2 to 4 mice). According to negative controls, values below 10–6 are considered background. The relative amplification was normalized to the amplification level of GAPDH.
