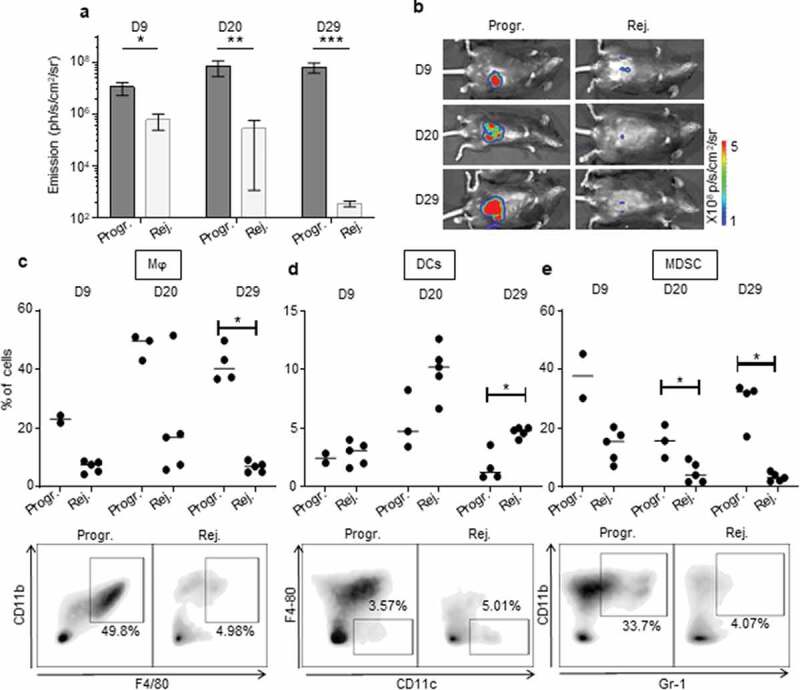
Figure 4.

The immunosuppressive myeloid cell-related microenvironment is characterized in progressive CRC mice. a, b.
Bioluminescent emission measurement (a) and representative photo of one mouse per group used for FACS analyses (b) at day (D) 9, 20, and 29 following IC-implantation of 1 × 10⁶ MC38-fLuc cells at D0. (Average ±SEM, n = 6–7 mice, 2 pooled experiments). c to e: Quantitative data (upper panels) and D29 representative FACS dot plot analyses (lower panels) of progressive or rejecting tumors-infiltrating macrophages (Mϕ, gated as Gr1−, F4/80+, CD11b+) (c), dendritic cells (DCs, gated as Gr1−, CD11 c+, F4/80−) (d) myeloid-derived suppressor cells (MDSC, gated as Gr-1+, CD11b+) (e) at D9, 20, and 29. Each dot corresponds to a single mouse with a median from one representative experiment (Exp#1; n = 2–5 mice). Percentages are expressed on CD45.2+ live cells. *P < 0,05. Progr. = progressive CRC, Rej. = Rejecting CRC.
