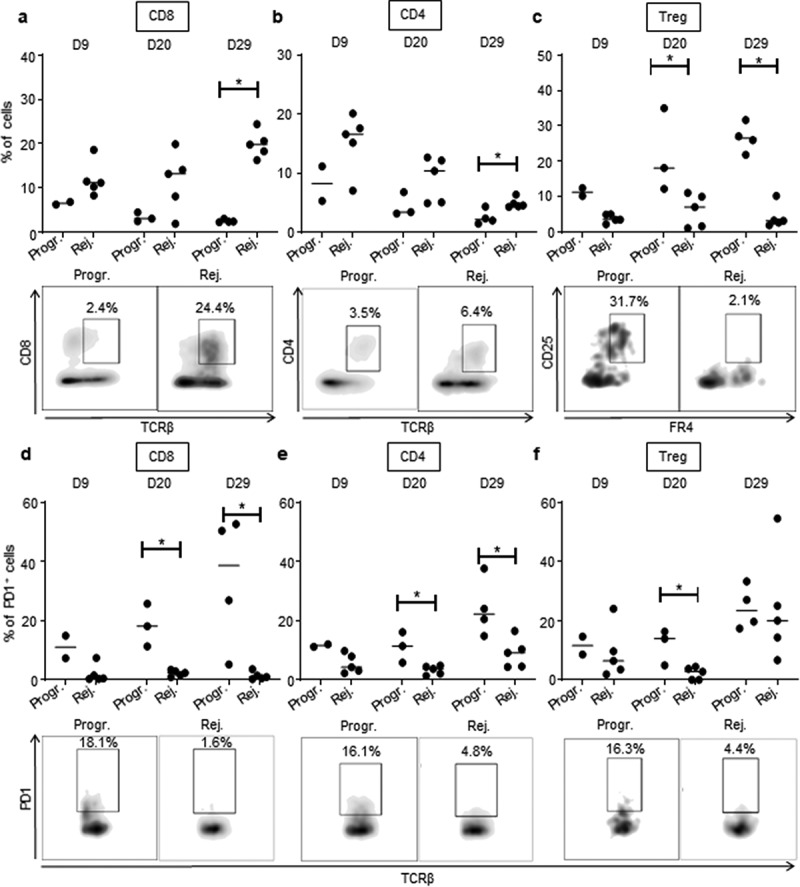
Figure 5.

High CD8 T cells and low Treg infiltration in rejecting CRC tumors.
Quantitative data (upper panels) and D29 (a, b, c) or D20 (d, e, f) representative FACS dot plot analyses (lower panels) of tumor-infiltrating CD8+ T lymphocytes (CD8, gated as TCRβ+, CD8+) (a), CD4+ T lymphocytes (CD4, gated as TCRβ+, CD4+) (b), regulatory T lymphocytes (Treg, gated as TCRβ+, CD4+,CD25+, folate receptor (FR)4+) (c) as well as PD1 expression on CD8+ T lymphocytes (d), CD4+ T lymphocytes (e) and regulatory T lymphocytes (f) at 9, 20 and 29 days, as depicted, following IC-injection of 1 × 10⁶ MC38-fLuc cells. Each dot corresponds to a single mouse with a median from one representative experiment (Exp#1; n = 2–5 mice). Percentages of CD8+ and CD4+ T cells are expressed on CD45.2+ live cells and percentage of Treg are expressed on total CD4+ T cells. *P < 0,05. Progr. = progressive CRC, Rej. = Rejecting CRC.
