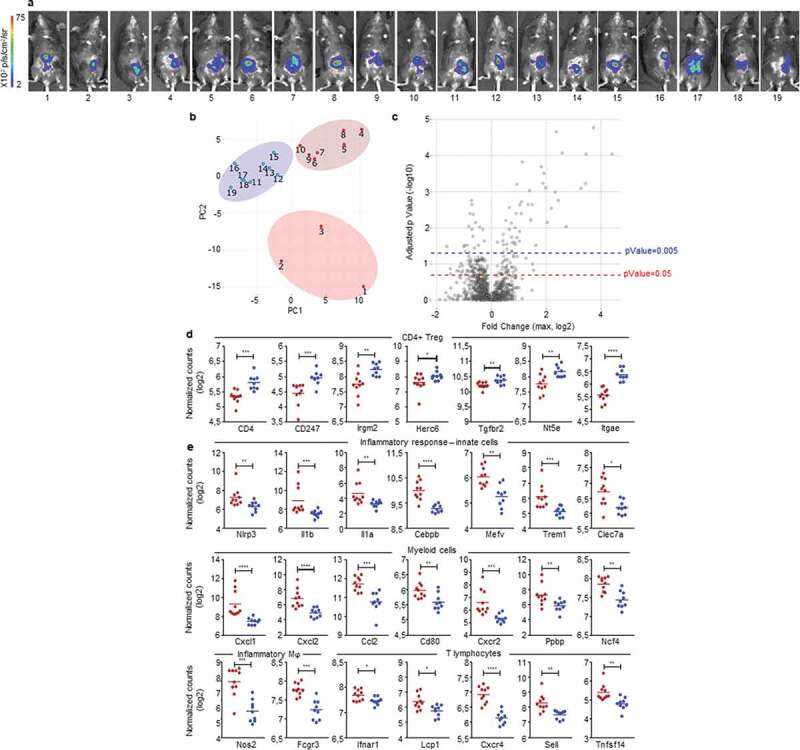
Figure 6.

Early detection of opposing immune microenvironments in CRC tumors.
Nanostring analysis of CRC tumors harvested at day 3 after IC implantation of 1.106 MC38-fLuc cells in B6 mice (n = 19 mice). (a) Bioluminescent representative images at 2 days post-tumor implantation. (b) Principal component analysis (PCA) based on the Nanostring analysis results revealing three groups of mouse tumor samples. (c) The three group of mice (from PCA) were compared using ANOVA corrected multiple testing correction by the Benjamin-Hochberg (BH) methods and all fold change (FC) were calculated. Volcano plot showing the max FC computed for each gene and the corresponding adjusted p-Value. Blue-dotted line indicate threshold for adjusted p-Value = 0.2 (p-Value = 0.05) and red-dotted line indicates adjusted p-Value = 0.05 (p-Value = 0.005). (d, e) Dot plots representing the average and individual tumor expression of selected genes (normalized counts in log 2) analyzed by Nanostring technology. Dark-red and blue dots correspond to tumors belonging to the dark-red or blue groups, respectively, represented on heat maps from Supplementary Fig. S6. Selected genes highly expressed in (d) blue group (CD4+ Treg pattern) and (e) dark-red group of tumors (Inflammatory response-innate cells, myeloid cells, inflammatory macrophages (Mϕ) and T lymphocytes are depicted. *P < 0.05, **P < .005, ***P < .0005, ****P < 0.0001.
