Figure 1.

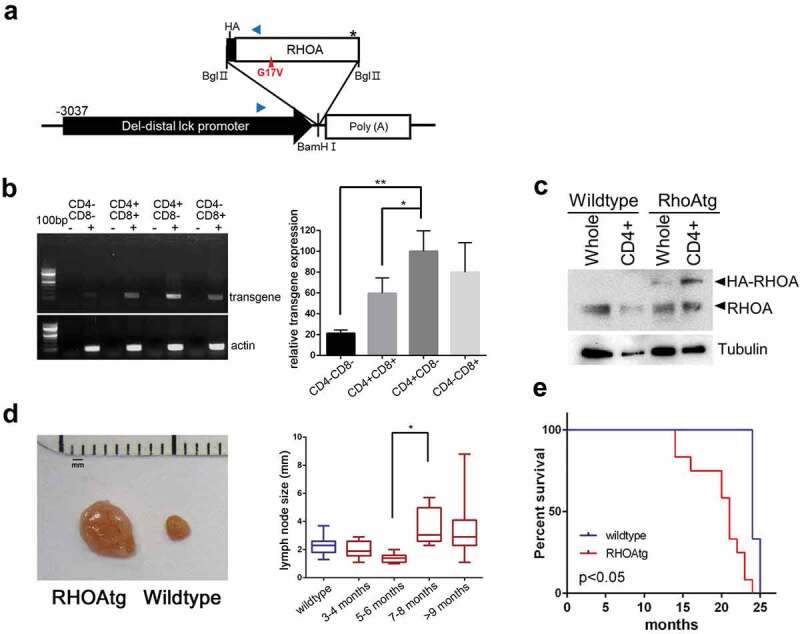
RHOA p.Gly17Val transgenic mice develop asymmetric lymphadenopathy. (a) A schematic diagram of transgene expression vector. Blue arrowheads indicate oligonucleotide primers for genotyping. (b) RT-PCR analysis shows that the transgene is most highly expressed in CD4+CD8− population. The graph on the right side shows results from three independent real-time RT-PCR analyses as means ± S.D. (*) and (**) represent P-values < 0.05 and <0.01, respectively. (c) Immunoblotting for RHOA protein. Note HA-tagged RHOA is seen only in the transgenic mice. Tubulin was used as loading control. (d) Asymmetric lymphadenopathy is seen in virtually all transgenic mice after a prolonged latency. A lymph node from 20-month-old mouse is seen next to a lymph node from an age-matched littermate wild type control mouse. Lymph node sizes of transgenic mice grouped into indicated age brackets. Note the significant increase in the 7–8 month group. (*) represents P-value < 0.05 from t-test. (e) Life span is significantly shortened in RHOA p.Gly17Val transgenic mice. P-value < 0.05 from log-rank test.
