
Figure 2.
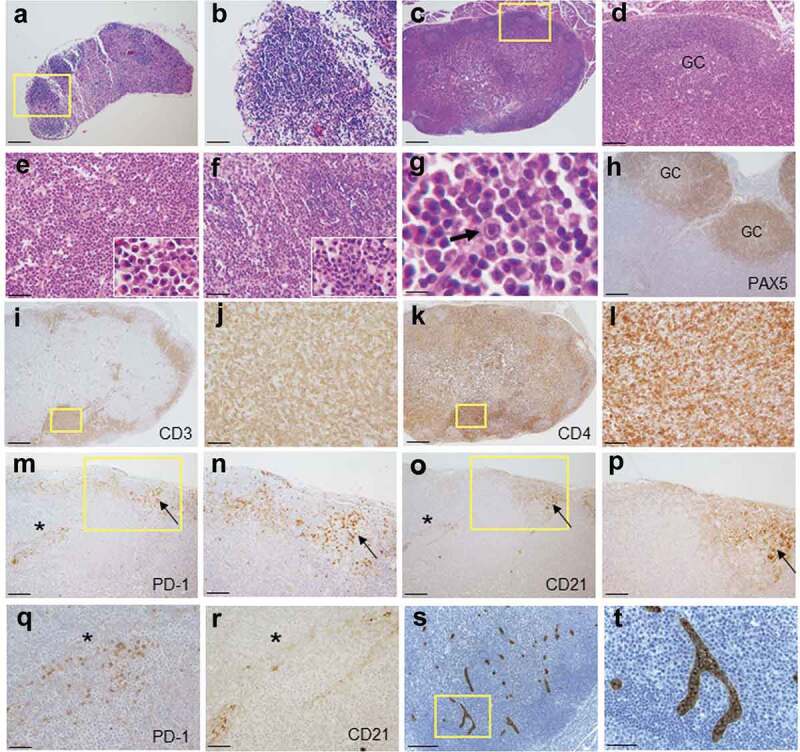
Histopathology of enlarged RHOA p.Gly17Val transgenic lymph nodes. (a, b) A lymph node from wild type mouse shows lymphoid aggregates in the cortex without germinal centers. The boxed region in A is shown in an enlarged form in B. (c, d). A lymph node from mutant mouse shows mixed cortical and paracortical hyperplasia with lymphoid follicles with germinal centers (GC). The boxed region in C is shown in an enlarged form in D. (e) The medullary area of lymph node is infiltrated by numerous plasma cells with readily recognizable morphology (see the higher magnification inset; also see supplementary material, Figure S2). (f, g) Occasionally, neutrophil infiltration (F and inset) and immunoblasts (G and arrow) are noted. (h-l) Immunoarchitecture of lymph node is shown by PAX5 (h), CD3 (i, j) and CD4 (k, l) staining. The boxed regions in I and K are shown in enlarged forms in J and L, respectively. (m–r) Sections from transgenic lymph nodes were also stained for PD-1 (m, n, q) and CD21 (o, p, r). The boxed regions in M and O are shown in enlarged forms in N and P, respectively. The region with asterisks in M and O are shown in enlarged forms in Q and R, respectively. Germinal center (arrow) is highlighted by nodular aggregates of CD21+ cells with dendritic pattern (o, p). PD-1+ cells are frequently observed in interfollicular area as well as within germinal center (m, n, q). Of note, CD21+ cells are also observed in extra-germinal center area (asterisks; O, R), where PD-1+ cells are also present (asterisks; M, Q). (s, t) Sections from transgenic lymph nodes are stained with MECA79 antibody specific for HEV. The boxed region in S is shown in enlarged forms in T. Scale bars represent: 10 μm for G; 50 μm B, E, F, J, L, Q, R, and T; 100 μm for D, H, N, and P.; 200 μm for A, M, O, and S; 500 μm for C, I and K.