Figure 4.

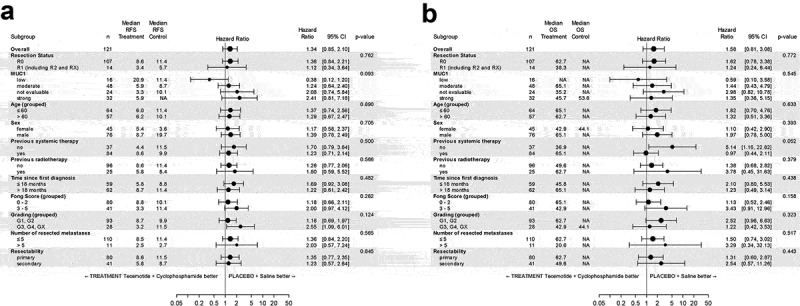
Forest Plots for the ITT population. A) Recurrence-free survival and B) Overall survival. P-values are for testing interaction of treatment with subgroup, thus describing difference in treatment effects across subgroups

Forest Plots for the ITT population. A) Recurrence-free survival and B) Overall survival. P-values are for testing interaction of treatment with subgroup, thus describing difference in treatment effects across subgroups