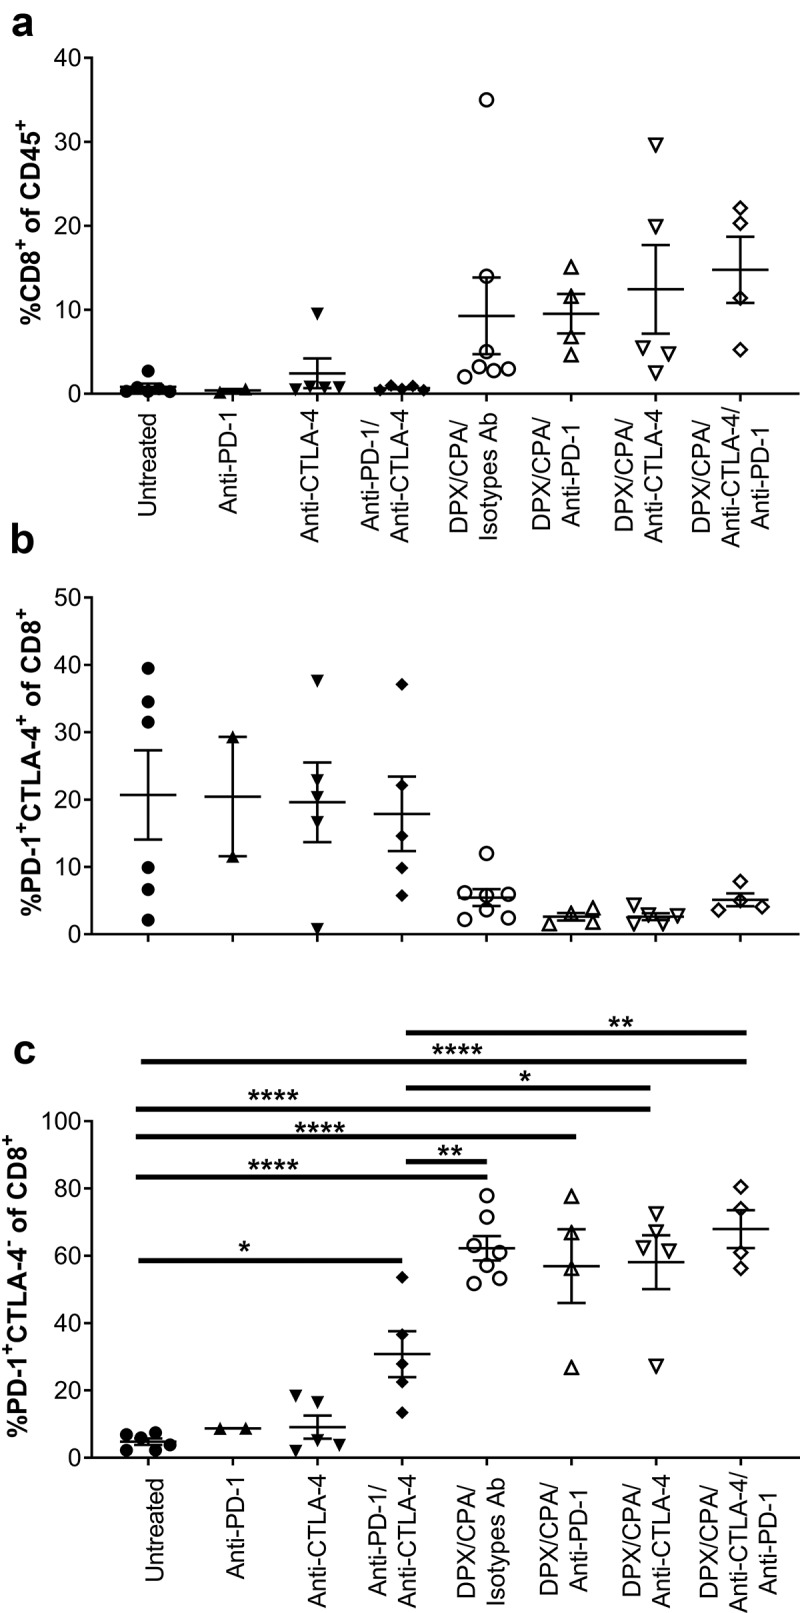
Figure 4.

Antibody targeting either PD-1 or CTLA-4 does not alter the DPX/CPA-induced recruitment of PD-1+CTLA-4− CD8+ T cells into the C3 tumor.
Mice bearing C3 tumors were treated with CPA and DPX-FP as stated in Figure 1. Anti-PD-1 or isotypes antibodies (Ab) were administered 6 days after DPX-FP treatment; anti-CTLA-4 or isotype Ab were administered on day of DPX-FP treatment. Ten days post DPX-FP treatment (stud day 31), mice were terminated. Tumors were dissociated and analyzed by flow cytometry to characterize CD8+ T cells and their expression of PD-1 and CTLA-4. A) Percent CD8+ T cells of CD45+ cells; B) Percent of PD-1+CTLA-4+ of CD8+ T cells; C) Percent of PD-1+CTLA-4− of CD8+ T cells. Experiment performed once. Order of samples in all panels: untreated n = 6 (filled circles); anti-PD-1 n = 2 (filled up-pointing triangles); anti-CTLA-4 n = 5 (filled down-pointing triangles); anti-PD-1/anti-CTLA-4 n = 5 (filled diamonds); DPX/CPA/Isotypes antibodies (Ab) n = 7 (empty circles); DPX/CPA/anti-PD-1 n = 4 (empty up-pointing triangles); DPX/CPA/anti-CTLA-4 n = 5 (empty down-pointing triangles); DPX/CPA/anti-CTLA-4/anti-PD-1 n = 4 (empty diamonds). Average ± SEM, statistics by one-way ANOVA followed by a Tukey’s multiple comparisons post-test, * p<0.05, ** p<0.01, *** p<0.001, **** p<0.0001. In panels A and C, ANOVA analysis indicated significant difference, but the Tukey’s post test could not identify which populations were different.
