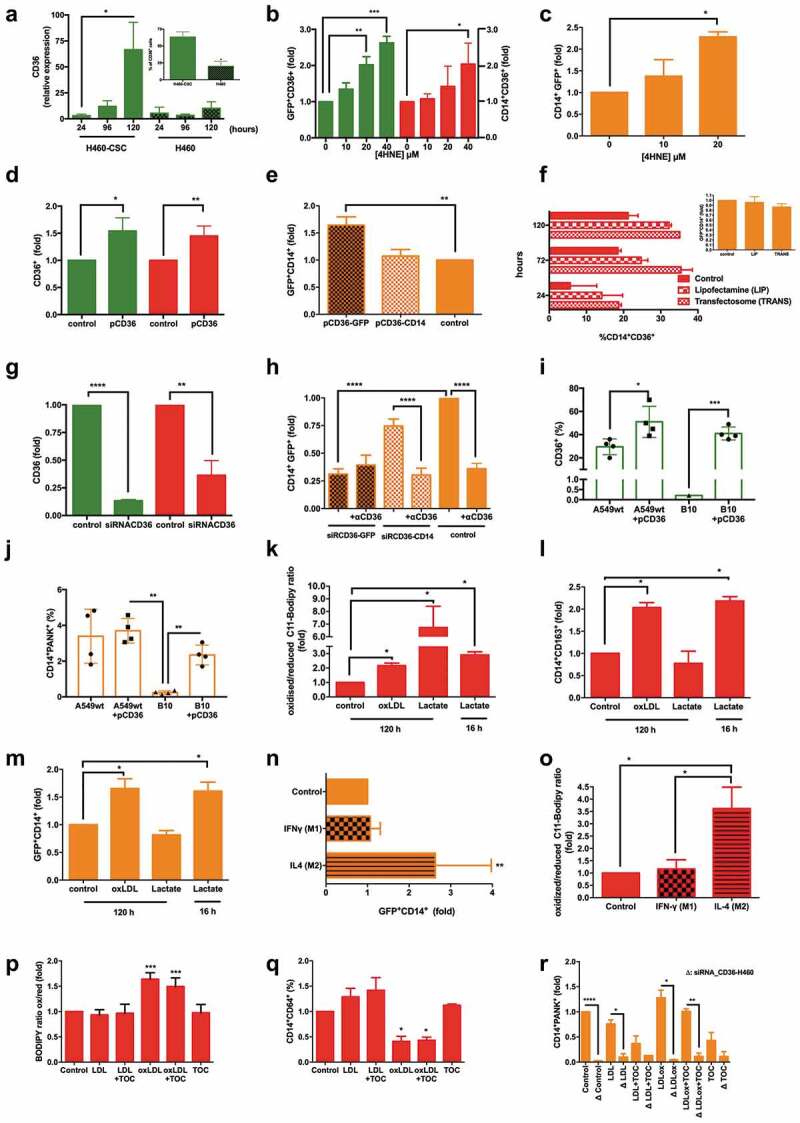
Figure 3.

Fusion process efficacy depends on both the regulation of CD36 expression by CSCs and microenvironmental lipids fluctuations, and the oxidative status and M2-phenotype of MΦs.
(a) Relative CD36 mRNA (RT-qPCR) expression of conditioned stem-like H460-CSC vs. native H460 cells, followed-up for 5 days (n = 7, *p = .003, one-way ANOVA/Tukey’s); Insert, FACS percentage of CD36+ cells at the end of the assay (n = 7, *p < .05, two-tailed t-test). (b) Overexpression (FACS) of CD36 in both CSCs (green) and monocytes (red) by 4HNE (n = 3, *p < .05, **p < .01, ***p < .001, two-tailed t-test). (c) Resulting fusion rates after 4HNE incubation; 40 µM was lethal (n = 3, *p = .004, one-way ANOVA/Tukey’s). (d) Specific pCD36 overexpression on CSCs (green) or monocytes (red) ((n = 3, *p = .018, **p = .014, two-tailed t-test). (e) Resulting fusion rates with CD36 overexpressing CSCs (brown) or monocytes (light orange) vs. a control co-culture (orange) (n = 3, **p = .005, one-way ANOVA/Tukey’s). (f) Two other ways to overexpress CD36 on monocytes (n = 2) and resulting fusion rates with CSCs (n = 2, insert). (g) Specific downregulation of CD36 on CSC (green) or monocytes (red) using siRNA-CD36 (n = 3, **p = .0012, ****p = .0001, two-tailed t-test). (h) Effects of siRNA-CD36 combined with α-CD36 and resulting fusion rates (n = 6, ****p < .0001, two-tailed t-test). (i, j) CD36 CRISPR-engineered KO abolish fusion event. (i) Increased levels of CD36 protein expression (FACS) by wild type A549-CSCs and clone B10, a CRISPR-engineered A549-CD36Δ/Δ–CSC clonal line, after transfection with pCD36 48 h before starting co-cultures with monocytes (n = 4, *p < .05, ***p < .001, two-tailed t-test). (j) Fusion event is rescued after B10 clone starts overexpressing CD36 (n = 4, **p < .01, two-tailed t-test). (k) Effects of stimulation with oxLDL or lactate (at two time-points of fusion: the last 16 h or a total of 96 h) on monocyte oxidative status (n = 4, *p = .02, one-way ANOVA/Tukey’s). (l) CD163 M2-polarization measure of previous monocytes (n = 4, *p = .01, one-way ANOVA/Tukey’s) (m) Resulting fusion rates with previous monocytes (n = 4, *p = .03, one-way ANOVA/Tukey’s). (n) Fusion rates reached under canonical (M1) vs. noncanonical (M2) stimulation of monocytes by either IFN-γ or IL-4, respectively (n = 3, ****p = .006, one-way ANOVA/Tukey’s). (o) Oxidative status of monocytes on both previous conditions (n = 3, *p = .017, one-way ANOVA/Tukey’s). (p, q) Effects of stimulation with LDL or oxLDL, alone or supplemented with tocopherol, as well as the latter alone on monocytes. (p) Oxidative status (n = 3, ***p < .001, two-tailed t-test) and (q) CD64 expression for M2-polarization measurement on CD14+ cells (n = 3, *p < .05, two-tailed t-test). (r) Effects of downregulate CD36 (siRNA-CD36) on H460-CSCs prior to co-culture with monocytes, then stimulating with LDL or oxLDL, alone or supplemented with tocopherol, as well as the latter alone, on hybrids yielding (n = 3, *p < .05, **p < .01, ***p <.0001, one-way ANOVA/Tukey’s). Data in A-R are mean ± SD.
