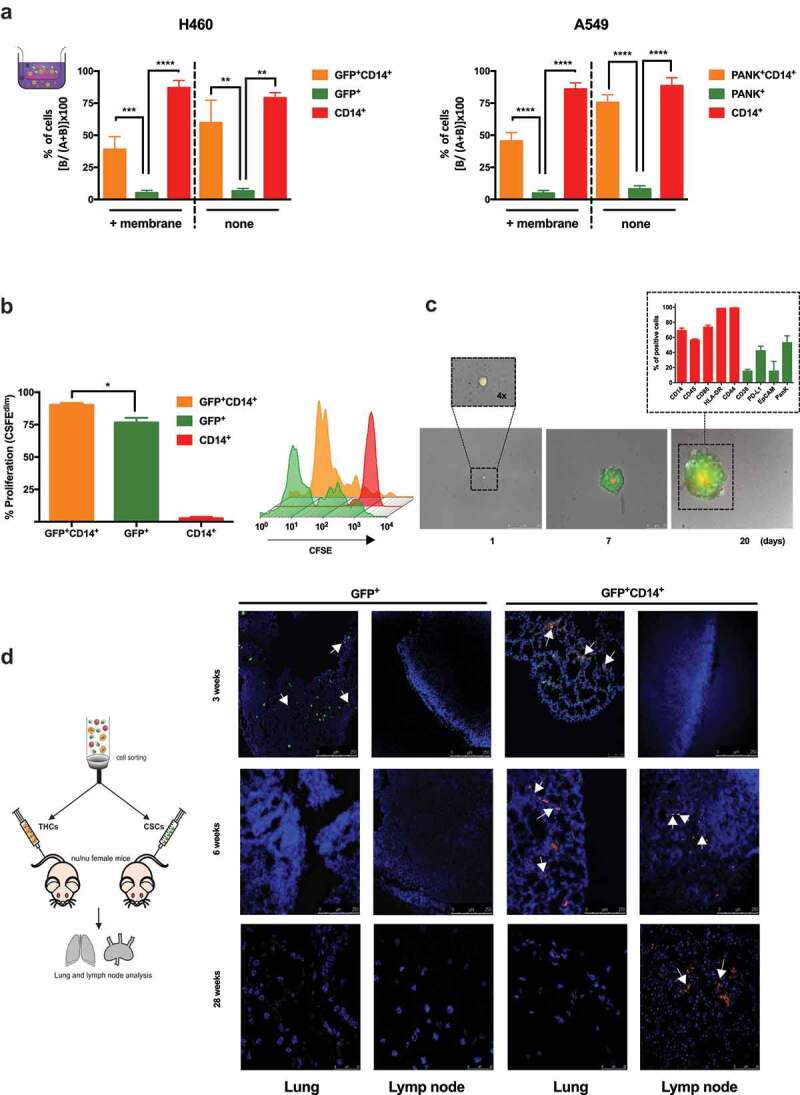
Figure 4.

THCs show migration and proliferation capabilities both in vitro and in vivo.
(a) Active and passive migration of the various populations involved in the fusion process. Left insert, a diagram of transwells showing the non-migrated cells (A) in the top chamber, and migrating cells (b) in the bottom chamber. Results for migration of fusion assays components from H460GFP-CSC (center) and A549-CSC (right) co-cultures, performed with (left side of each graph) or without a collagen-covered membrane (right side of each graph). Hybrids (GFP+CD14+ or PANK+CD14+, for H460GFP or A549, respectivelyy), orange bars; CSCs (idem, GFP+ or PANK+), green bars; monocytes, red bars (n = 3, **p < .01, ***p < .001, ****p < .0001, one-way ANOVA/Tukey’s, data are mean ± SD). (B) Proliferation rate differences amongst the three sorted cell types as measured by CFSE dimming after 7 days of growth (n = 3, *p =.01, one-way ANOVA/Tukey’s, data are mean ± SD); and a representative diagram of proliferative cells (insert). (c) After 5 days, co-cultures of H460GFP-CSC and monocytes were sorted and single hybrids seeded on 96-well plates, then followed-up during 20 days (a representative experiment is shown, a 1-day single cell is shown 4x magnified; n = 45); Insert, 20 days old tumors expression of several markers (n = 5, data are mean ± SD). (d) Mice experimental design (left) for in vivo hybrid invasiveness characterization. Lungs and lymph nodes (right) were analyzed for the presence of GFP+ (H460GFP-CSC) and GFP+CD14+ (hybrids) cells after 3, 6 and 28 weeks (n = 5 for each treatment) of i.v. tail inoculation.
