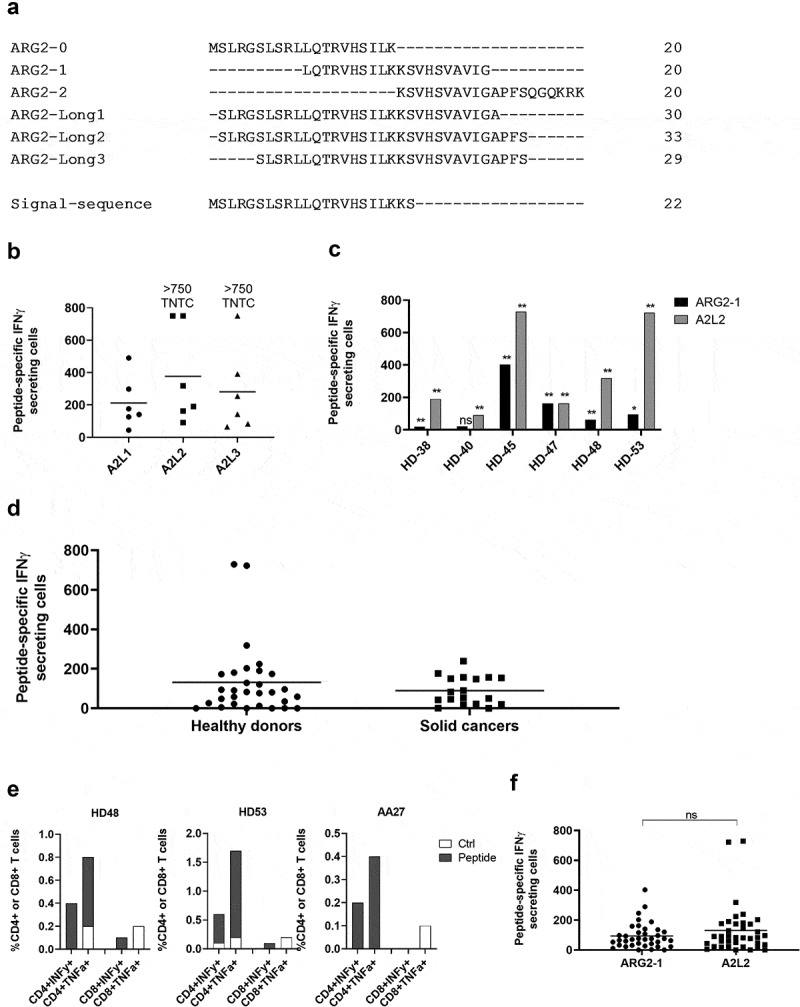
Figure 3.

The long ARG2 peptide A2L2 elicits strong and frequent CD4 + T-cell responses in samples from healthy donors and cancer patients. (a) Aligned peptide sequences of the library peptides ARG2-0, ARG2-1, and ARG2-2 and the long peptides ARG2-Long1 (A2L1), ARG2-Long2 (A2L2), and ARG2-Long3 (A2L3). The signal sequence of ARG2 is shown for comparison. (b) IFNγ ELISPOT responses against the long peptides A2L1, A2L2, and A2L3 in PBMCs from six healthy donors. 4 × 10⁵ cells were plated per well, and peptide and control stimulation were performed in triplicate. Specific spot counts (peptide-specific IFNγ-secreting cells) are given as the difference in number of IFNγ spots between averages of the wells stimulated with peptide and control wells. Responses against peptide were too numerous to count (TNTC) in 3 settings and set to be >750 spots. (c) IFNγ ELISPOT responses to A2L2 and ARG2-1 in PBMCs from 6 healthy donors. 4 × 10⁵ cells were plate per well, and peptide and control stimulation were performed in triplicate. Specific spot counts (peptide-specific IFNγ-secreting cells) are given as the difference in number of IFNγ spots between averages of the wells stimulated with peptide and control wells. * p ≤ 0.05 or ** p ≤ 0.01 according to the distribution free resampling rule. (d) IFNγ ELISPOT responses against A2L2 peptide in PBMCs from healthy donors (n = 30) and cancer patients with solid tumors (n = 18). 3–4 × 10⁵ cells were plated per well. Peptide and control stimulations were performed in triplicate. Each spot represents one donor and is the number of peptide-specific IFNγ-secreting cells (the difference between the average of wells stimulated with peptide and control wells). (e) Representative intracellular cytokine staining for IFNγ and TFNα production in samples from healthy donors (HD48 and HD53) and a cancer patient (AA27) with solid tumors stimulated with A2L2 or non-stimulated control. (f) FNγ ELISPOT responses to ARG2-1 and A2L2 in PBMCs from healthy donors (n = 26) and cancer patients with solid tumors (n = 11) for comparison of the magnitude of responses to the two peptides. 4 × 10⁵ cells were plated per well, and peptide and control stimulation were performed in triplicate. Specific spot counts (peptide-specific IFNγ-secreting cells) are given as the difference in number of IFNγ spots between averages of the wells stimulated with peptide and control wells. ns: p = .7038.
