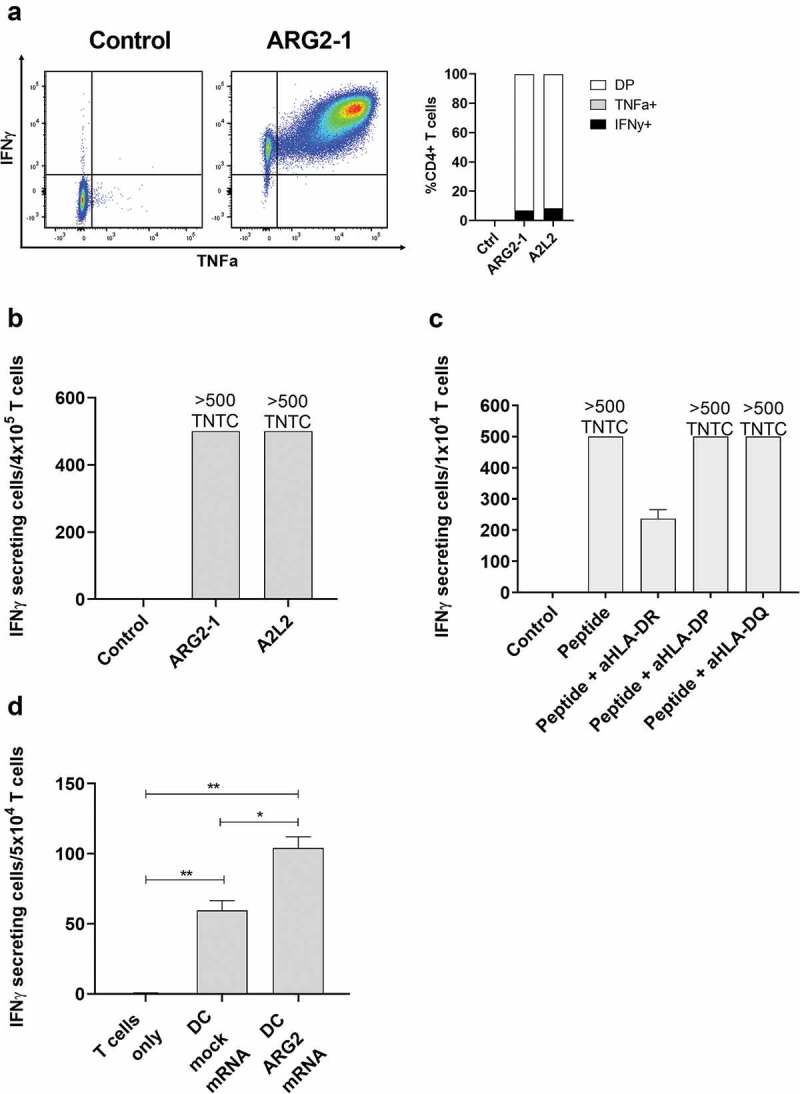
Figure 4.

ARG2-specific T-cells recognize ARG2-expressing dendritic cells. (a) ARG2-specific T-cells were expanded from samples from a patient with prostate cancer. The specificity of the T-cell culture was assessed by intracellular cytokine staining for TFNα and IFNγ production in peptide-stimulated cells and a non-stimulated control. Left: Dot plot for ARG2-1 peptide-stimulated and non-stimulated (control) cells. Right: % CD4 T-cells producing IFNγ, TFNα, or both (DP: double positive) in response to control stimulation (no peptide), ARG2-1 peptide stimulation, or A2L2 peptide stimulation. (b) Specificity of the ARG2-specific T-cells assessed by ELISPOT responses to control stimulation (no peptide), ARG2-1 peptide, or A2L2 peptide. 4 × 10⁴ cells were plated per well. TNTC, too numerous to count (more than 500 spots). (c) he HLA-restriction of ARG2-specific T-cells were examined. IFNγ ELISPOT response of the ARG2-specific T-cells toward ARG2-1 peptide in the presence of different class II blockers. (d) IFNγ ELISPOT response by the ARG2-specific T-cells to autologous dendritic cells transfected with irrelevant control mRNA (mock mRNA) or ARG2 mRNA. Effector-to-target ratio 5:1 with 5 × 10⁴ effector cells plated per well. * p ≤ 0.05 or ** p ≤ 0.01 according to the distribution free resampling rule.
