
Figure 1.
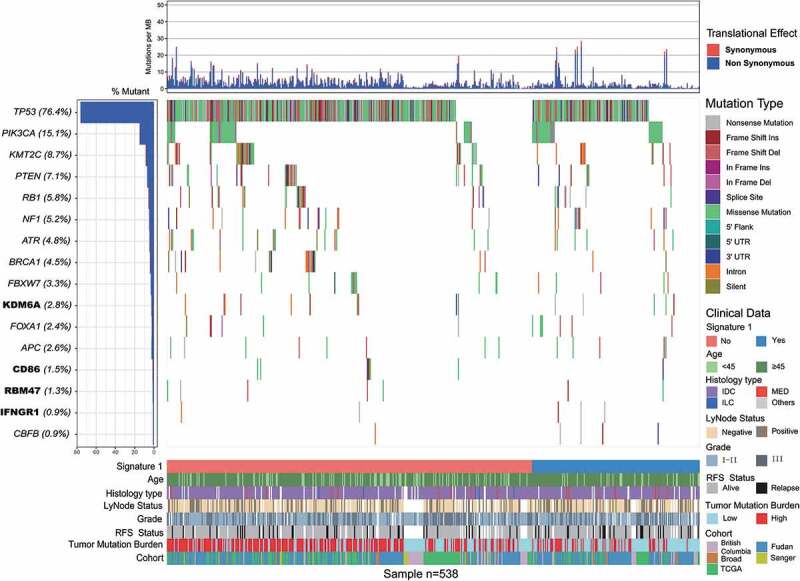
Mutational landscape of significantly mutated genes in triple-negative breast cancer (TNBC) patients.
The left panel indicated gene mutation frequency, the upper panel showed mutational prevalence with respect to synonymous and non-synonymous mutations, the middle panel depicts genes mutation landscape across analyzed cases with different mutation types color coded differently, and the bottom panel displayed clinical features such as signature 1 status, age, histological type, grade, survival status, tumor mutation burden and cohort. New significantly mutated genes were highlighted in upper left bold.