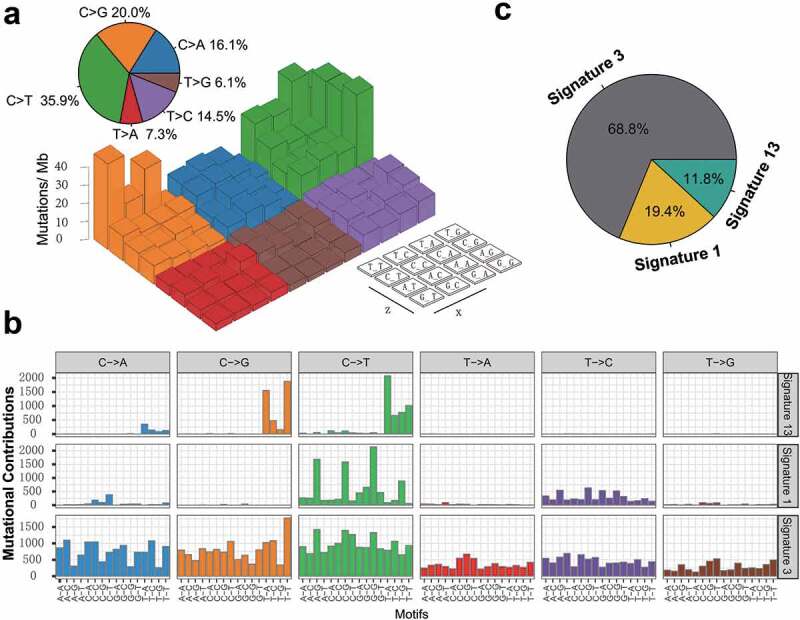
Figure 2.

Mutational signatures extracted from the aggregated TNBC dataset.
(a) Lego plot representation of mutation patterns in 538 TNBC samples. Single-nucleotide substitutions were divided into six categories with 16 surrounding flanking bases. The pie chart in upper left showed the proportion of six categories of mutation patterns. (b) The mutational activities of corresponding extracted mutational signatures (Signature 1,3,13 and unmatched, named as COSMIC signature). The trinucleotide base mutation types were on the X-axes, whereas Y-axes showed the percentage of mutations in the signature attributed to each mutation type. (c) The mutational activities of corresponding mutational signatures showed in pie chart.
