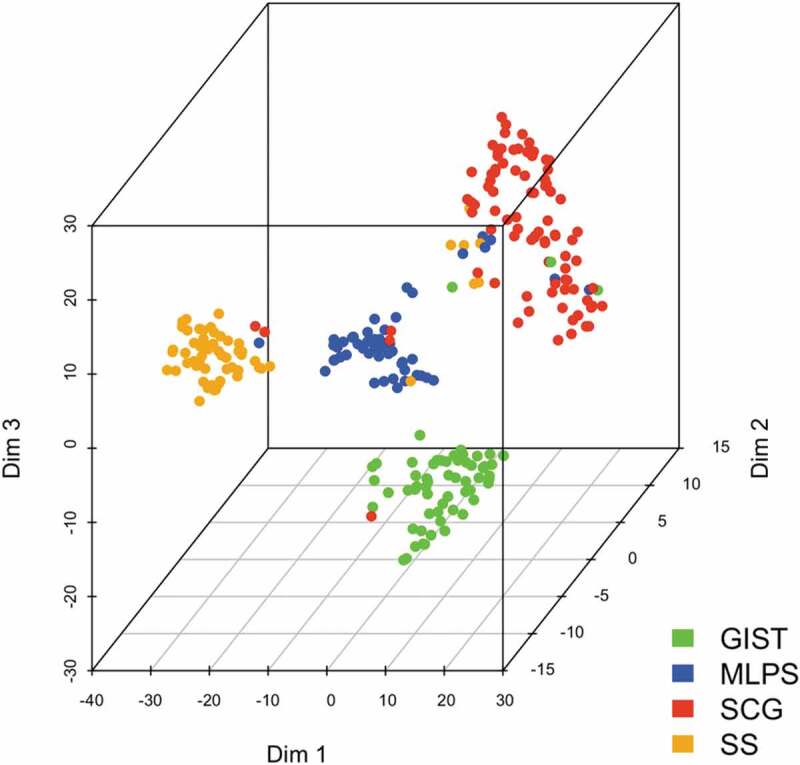
Figure 2.

Correlation of ICP/MM genes expression with histological sarcoma subtype with t-SNE. t-SNE analysis processing a non-linear dimension reduction of the signature for all samples. Points are sarcomas highlighted in colors for each histological subtype (Dim: dimension).
