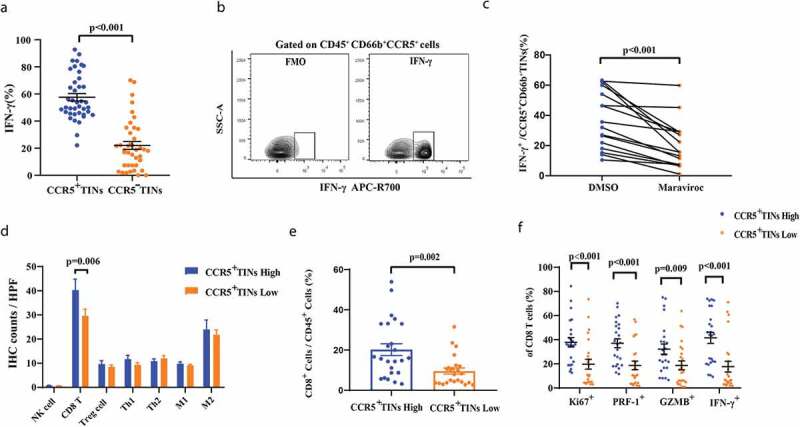
Figure 4.

CCR5+CD66b+TINs could illustrate anti-tumor immunity contexture in MIBC patients through IFN-γ secretion, which could be reduced by CCR5 inhibitor maraviroc partially. (a) Flow cytometry analysis of IFN-γ+ cells frequencies of CCR5+TIN cells and CCR5−TIN cells in MIBC fresh samples (n = 40). Data were analyzed using Wilcoxon signed-rank test. (b) The contour plot representative gating figures for IFN-γ+ cells by flow cytometry of IFN-γ mAB stained CCR5+CD66b+TINs compared with IFN-γ mAB unstained CCR5+CD66b+TINs in one MIBC patient fresh sample. FMO, fluorescence minus one. (c) Quantification of IFN-γ+CCR5+CD66b+TINs frequencies of CCR5+CD66b+TINs in MIBC (n = 16) tissue samples after treated with CCR5 inhibitor maraviroc (10uM) or DMSO for 12 hours. Data were analyzed using Wilcoxon signed-rank test. (d) Quantification analysis of immune cells between CCR5+CD66b+TINs high/low subgroups in MIBC tissue microarray (TMA) by immunohistochemistry (IHC) (n = 141). Data were analyzed using Mann-Whiney U test, and showed as mean ± SEM. (e) Flow cytometric analysis of the CD8+ cells frequencies/CD45+ cells between CCR5+CD66b+TINs high/low subgroups in fresh samples of MIBC (n = 48). (f) Flow cytometric analysis of the Ki67+, PRF-1+, IFN-γ+, GZMB+ cells frequencies of CD8 T cells (n = 48) between CCR5+CD66b+TINs high/low subgroups in fresh samples of MIBC. (e-f) CCR5+CD66b+TINs High/low were grouped by median. (d-f) Data were analyzed using Mann-Whiney U test, and showed as mean ± SEM. Treg cell = T regulatory cells: foxp3; Th1 = type 1 helper cells; Th2 = type 2 helper cells; M1 = type 1 macrophages; M2 = type 2 macrophages; IFN = interferon; GZMB = granzyme B; PRF-1 = perforin.
