
Figure 1.
Construction of gene signature.
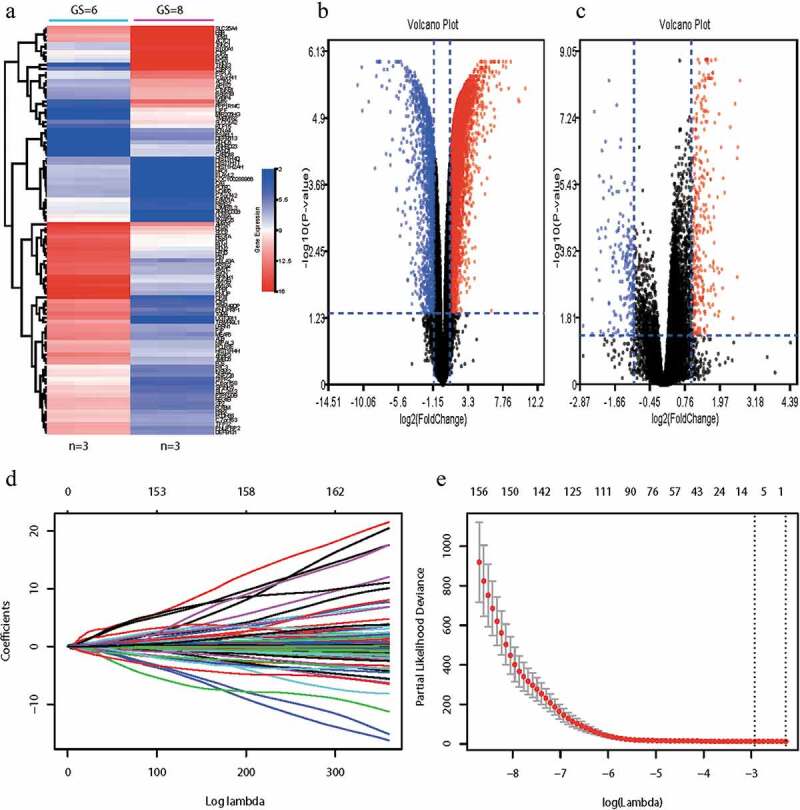
(a) Heat map showed differentially expressed genes in our microarray data from patients with Gleason scores ≤6 and ≥8. (b) Volcano plot of differentially expressed genes between tissues with Gleason score ≤6 and tissues with Gleason score ≥8 in FUSCC set. The red dot represents up-regulated genes and blue dot represents down-regulated genes. (c) Volcano plot of differentially expressed genes between tissues with Gleason score ≤6 and tissues with Gleason score ≥8 in discovery set. The red dot represents up-regulated genes and blue dot represents down-regulated genes. (d) LASSO coefficient profiles of the 167 candidate genes. A vertical line is drawn at the value chosen by 10-fold cross-validation. (e) Partial likelihood deviance for the LASSO coefficient profiles. Six genes were selected at the value (lambda.min).