
Figure 2.
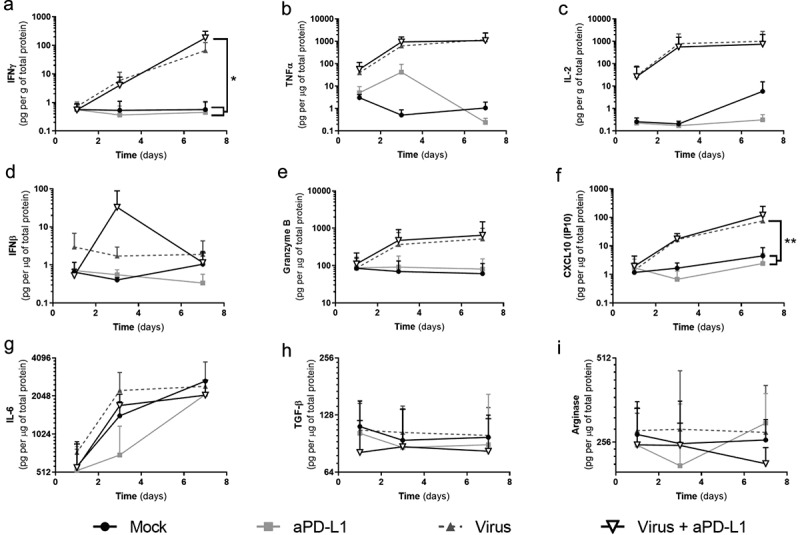
Responses to virotherapy and checkpoint inhibitor treatments at the cytokine level across 7 d of treatment.
Expression values from three individual patient-derived tumor histocultures were plotted together. (a) IFNg. (b) TNFa. (c) IL-2. (d) IFNb. (e) Granzyme B. (f) CXCL10. (g) IL-6. (h) TGFb. (i) Arginase. Statistical significances calculated by two-way ANOVA. (*p < .05; **p < .01). Mean and standard error of the mean (SEM) are shown.