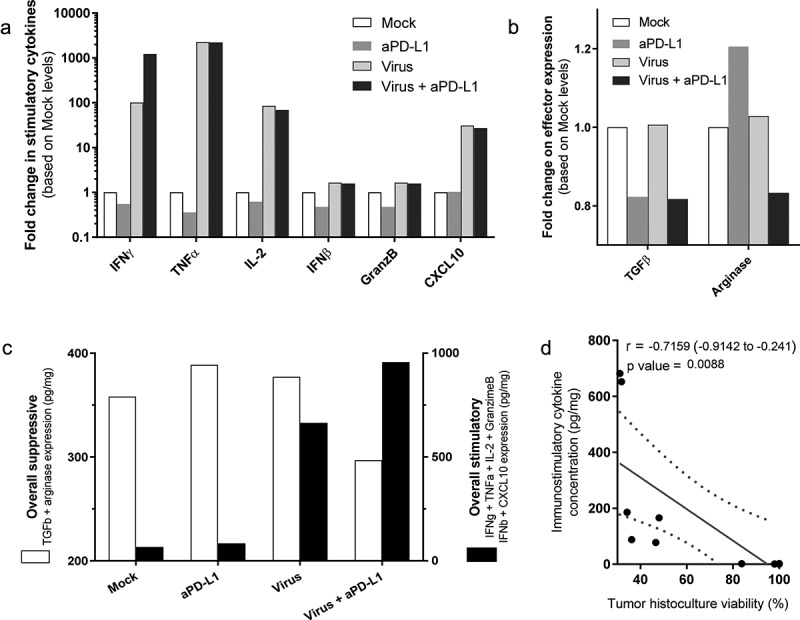
Figure 3.

Analyses of grouped cytokine responses to virotherapy and checkpoint inhibitor treatments on day 7.
Expression values from three different patient-derived tumor histocultures were plotted together. (a) Fold change in immunostimulatory cytokines. (b) Fold change in immunosuppressive effectors. (c) Overall suppression (including TGF-b and arginase) vs overall stimulation (including IFNg, IFNb, granzyme B, and CXCL10). (d) Pearson’s r correlation between immunostimulatory cytokine expression and tumor histoculture viability.
