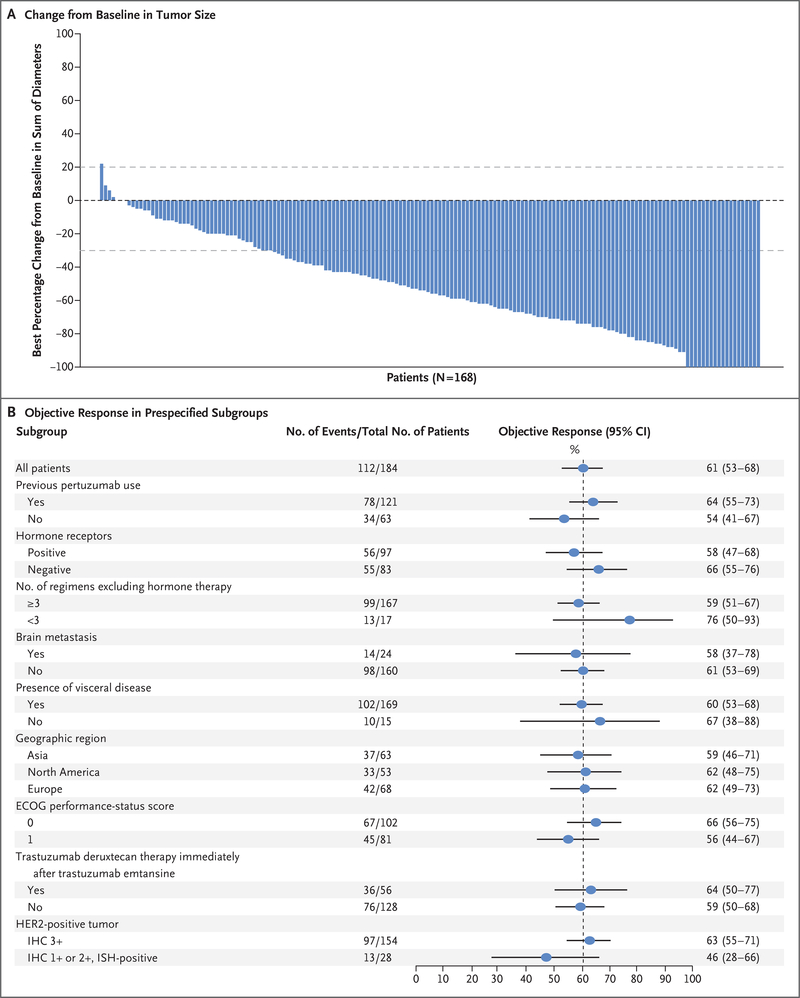
Figure 2. Response to Trastuzumab Deruxtecan, According to Tumor Size and Subgroup Analyses.
Panel A shows the best percentage change from baseline in the sum of the largest diameters of measurable tumors in 168 of 184 patients for whom data from both baseline and postbaseline assessments of target lesions by independent central review were available. The upper dashed horizontal line indicates a 20% increase in tumor size in the patients who had disease progression, and the lower dashed line indicates a 30% decrease in tumor size (partial response). Panel B shows the objective partial or complete response to trastuzumab deruxtecan therapy in all the enrolled patients who received 5.4 mg per kilogram, according to subgroup. Data for patients with an immunohistochemical (IHC) score indicated as 1+ (IHC negative) or 2+ (IHC borderline) include data for patients for whom the result was equivocal or could not be evaluated; a score of 3+ indicates positivity for HER2 (human epidermal growth factor receptor 2). HER2 positivity is also indicated by an IHC score of 1+ or 2+ and positive results on in situ hybridization (ISH). The vertical dashed line at the 61% mark indicates the median response to therapy in the overall population. ECOG denotes Eastern Cooperative Oncology Group.

