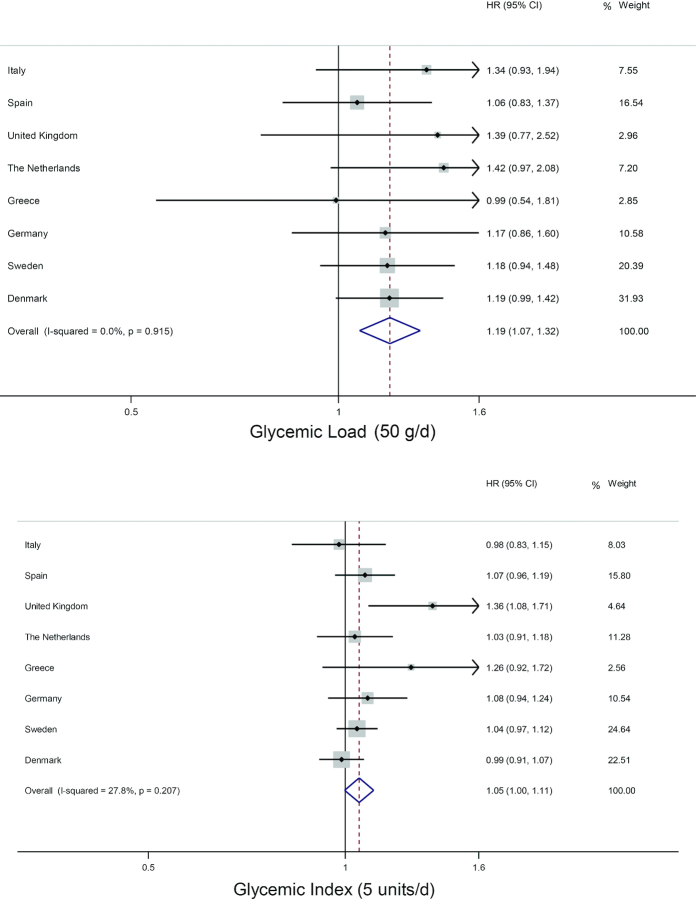
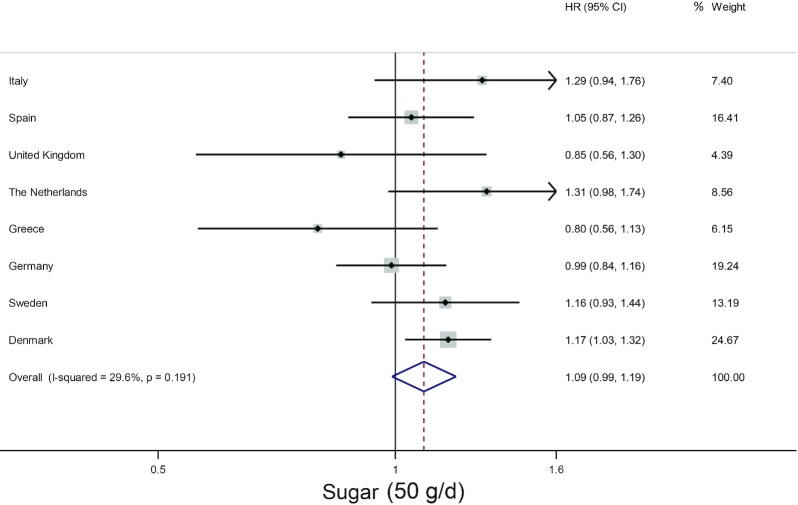
FIGURE 1.
Forest plots showing country-specific HRs and 95% CIs for coronary heart disease in relation to dietary glycemic load; dietary glycemic index; and intakes of available carbohydrate, starch, and sugar. The HRs were obtained from model 3, which was adjusted for age; sex; study center; smoking; education; physical activity; BMI; blood pressure; and intakes of energy, protein, alcohol, fiber (available carbohydrate, starch, and sugar), cereal fiber (GI and GL), and saturated and monounsaturated fat. The analyses were stratified by country and combined with random-effects meta-analysis. Weights are from random-effects analysis.


