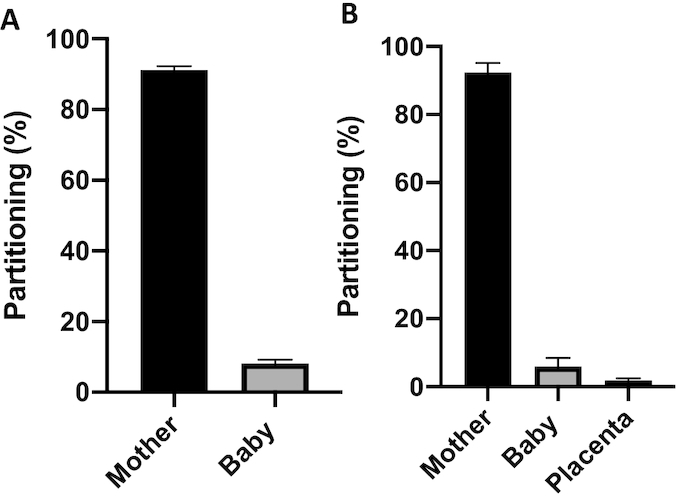
FIGURE 3.

(A) Partitioning of iron between the maternal and neonatal compartment is shown for the combined cohort (n = 60). The bar chart presents the percentage (95% CI) of total iron partitioned to each compartment. In the multiples cohort, the baby component reflects the sum of all tracer recovered in the neonatal compartments. (B) Partitioning of iron between the maternal, neonatal, and placental compartments is shown for women in the Rochester cohort who had placental tissue available for analysis of isotopic enrichment.
