Figure 7.
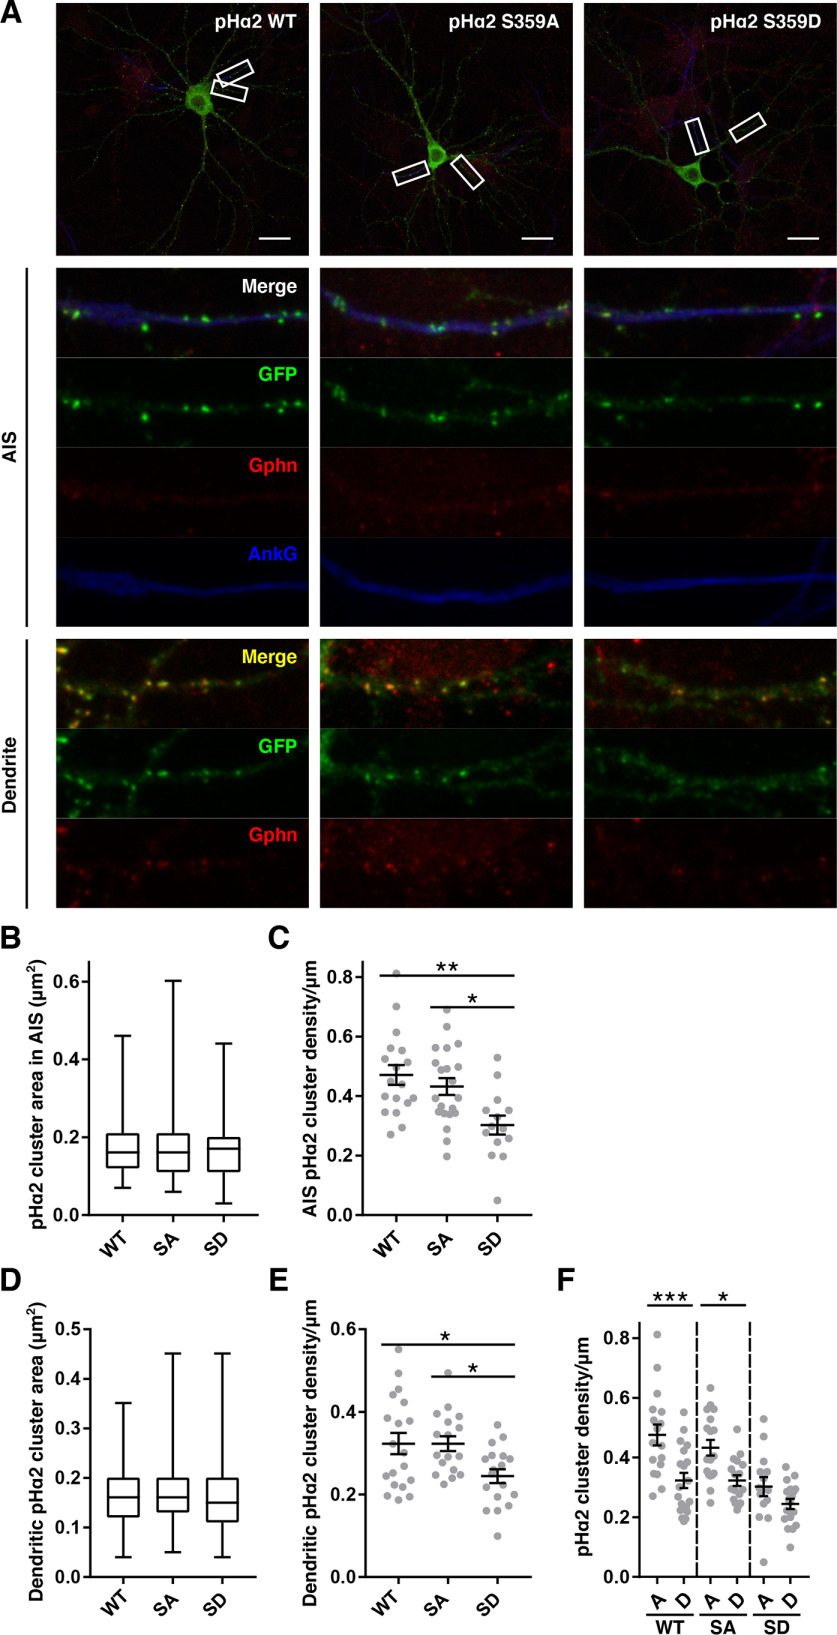
Phosphomimetic mutations of α2 Ser-359 reduce pHα2 cluster density in neurons. A, top, hippocampal neurons transfected at 15 DIV with pHα2 WT, S359A, or S359D and fixed at 19 DIV. Neurons were stained with anti-GFP (green), anti-gephyrin (red), and anti-ankyrin G (blue) antibodies. Scale bar, 20 μm. White boxes are magnified in the images below depicting a 20-μm section of AIS and dendrite. B and D, quantification of pHα2 cluster area in the AIS and dendrites, respectively. Box-and-whisker plots, minimum, lower quartile, median, upper quartile, and maximum values; Kruskal–Wallis test. C and E, quantification of pHα2 cluster density in the AIS and dendrite, respectively. Data are means ± S.E. (error bars) *, p < 0.05; **, p < 0.01; one-way ANOVA with Tukey's post hoc test. F, quantification of pHα2 cluster density in the AIS (A) and dendrite (D) as shown in C and E. n = 3 individual cell culture preparations (AIS: 18 WT, 21 SA, and 14 SD cells; dendrite: 19 WT, 17 SA, and 18 SD cells). Data are means ± S.E. (error bars). *, p < 0.05; ***, p < 0.001; one-way ANOVA with Sidak's post hoc test.

