Figure 1.

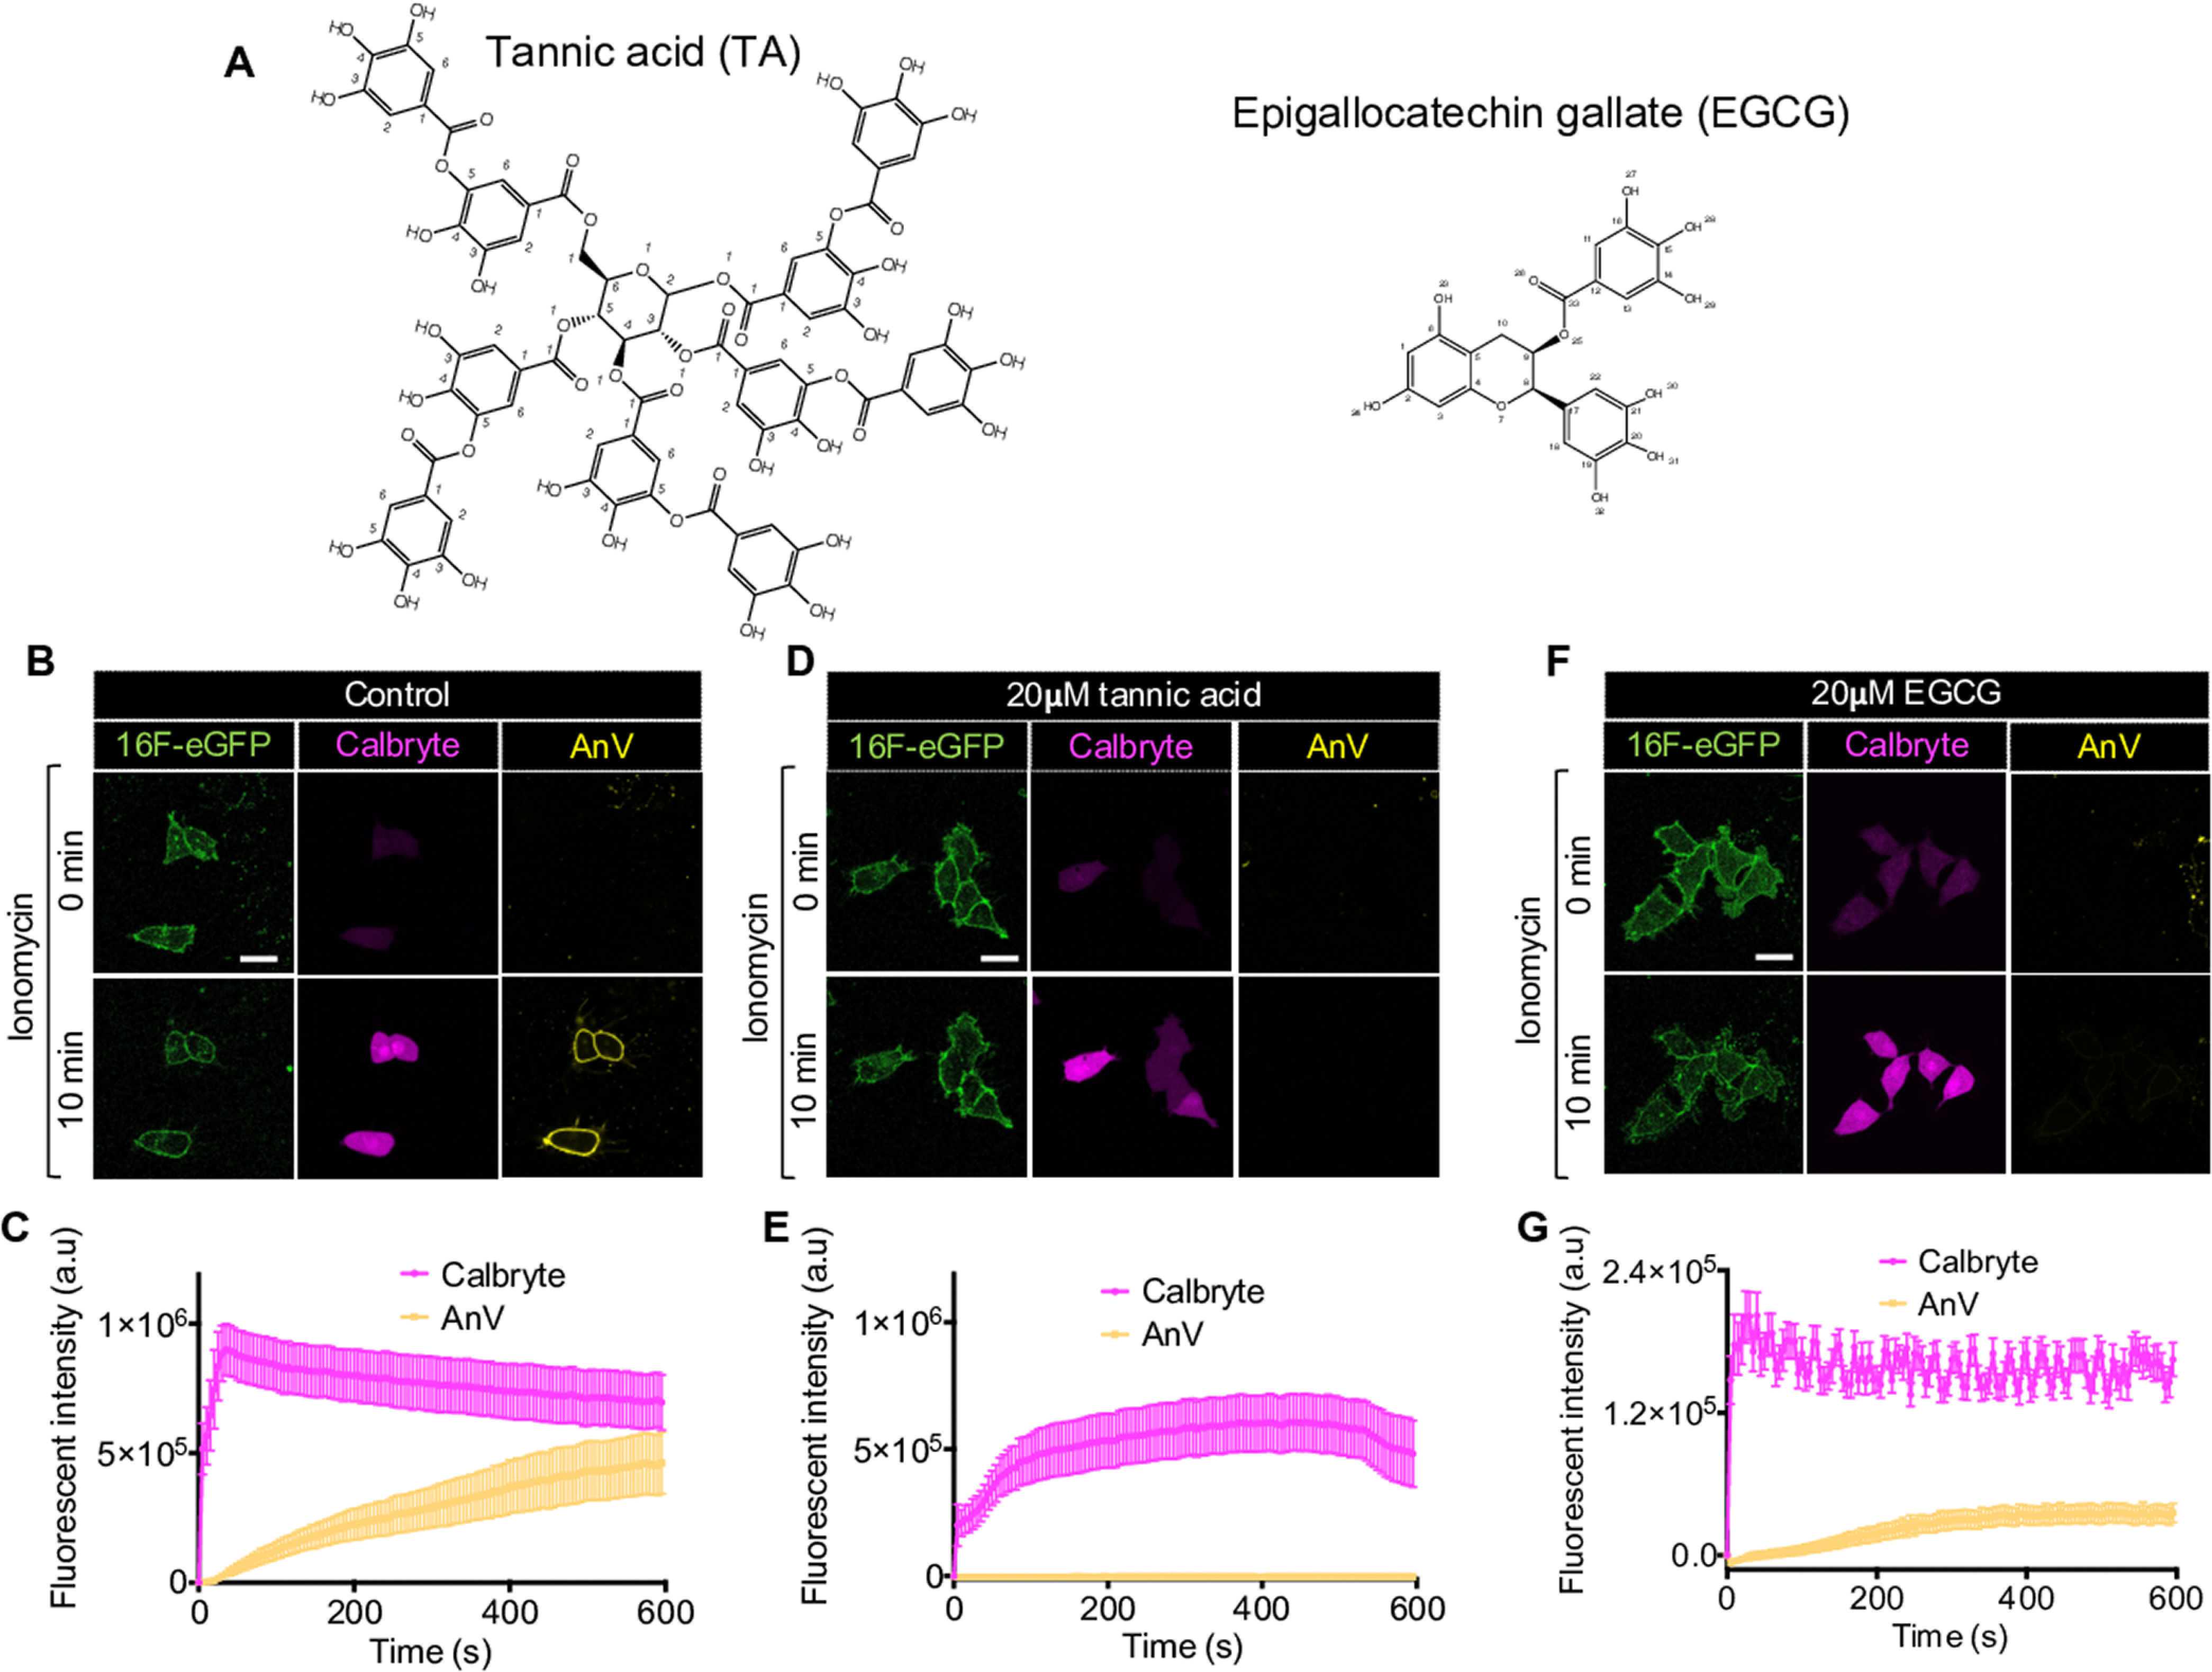
TA and EGCG diminish fluorescently tagged AnV-CF640R signal. A, chemical structures of TA and EGCG. B, D, and F, representative images show that TA (D) and EGCG (F) treatments do not affect ionomycin-induced intracellular Ca2+ influx (labeled by Calbryte (magenta)), but the polyphenols completely suppress AnV-CF640R signal (yellow) on HEK293 cells stably expressing mouse TMEM16F (green) even after 10 min of ionomycin treatment. Scale bars, 25 μm. Without TA and EGCG, the cells have normal AnV signal accumulating on their membrane after ionomycin stimulation (B). C, E, and G, fluorescence intensity changes of Calbryte and AnV over 10 min of ionomycin treatment for the cells in B, D, and F, respectively. n = 3–5 cells. Error bars, S.E. All images are representative of at least three independent biological replicates. a.u., arbitrary units.
