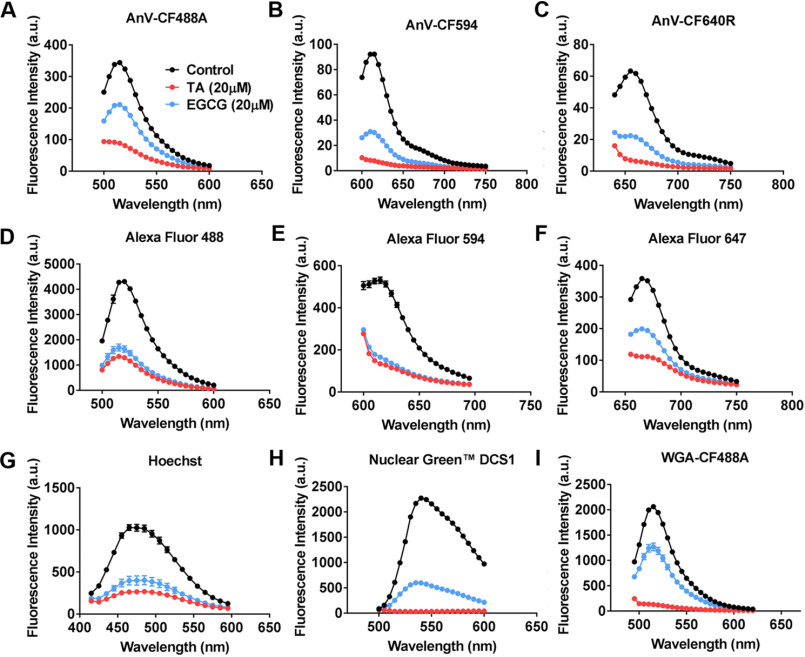
Figure 3.
Effects of TA and EGCG on fluorescence signal of different fluorophores and fluorescence probes in aqueous solution. 20 μm EGCG (blue traces) and 20 μm TA (red traces) were applied to various fluorescence probes/fluorophores, and the intensities of the emission spectra of the fluorophores were measured by the spectrometry function of a plate reader (see “Experimental procedures” for details). Controls (black traces) are fluorescence probes/fluorophores in the absence of TA and EGCG. A, 0.75 µg/ml AnV-CF488A; B, 0.75 µg/ml AnV-CF594; C, 0.75 µg/ml AnV-CF640R; D, 4 µg/ml IgG-Alexa Fluor 488; E, 4 µg/ml IgG-Alexa Fluor 594; F, 4 µg/ml IgG-Alexa Fluor 647; G, 16 μm Hoechst in the presence of 10 μm nucleotide; H, 1:500 Nuclear Green DCS1 in the presence of 10 μm nucleotide; I, 4 mg/ml WGA-CF488A. Data are presented as mean ± S.E. (error bars). a.u., arbitrary units.

